Monitor your crops. Control your harvest.
Sentilli combines crop intelligence with harvest logistics in one platform — so you understand every field, predict every yield, and execute every operation with precision.
Satellite images in one tool
Weather data in another
Spray records in a spreadsheet
“When a field underperforms at harvest, they can't answer the most basic question: What happened?”
Two modules. One complete system.
From satellite to harvest truck — everything your operation needs.
Satellite imagery, AI stress analysis, yield prediction, soil intelligence, growth tracking, irrigation management, and in-field sensors — everything you need to understand what's happening in every field and why.
Live equipment tracking, harvest simulation, crew scheduling, factory capacity modeling, and labor cost analysis — plan the season, then execute it.
Sentilli Overview
Crop Monitoring & Intelligence
See every field. Know which need attention.
Your entire operation at a glance — grid view, map view, or ranked by performance.
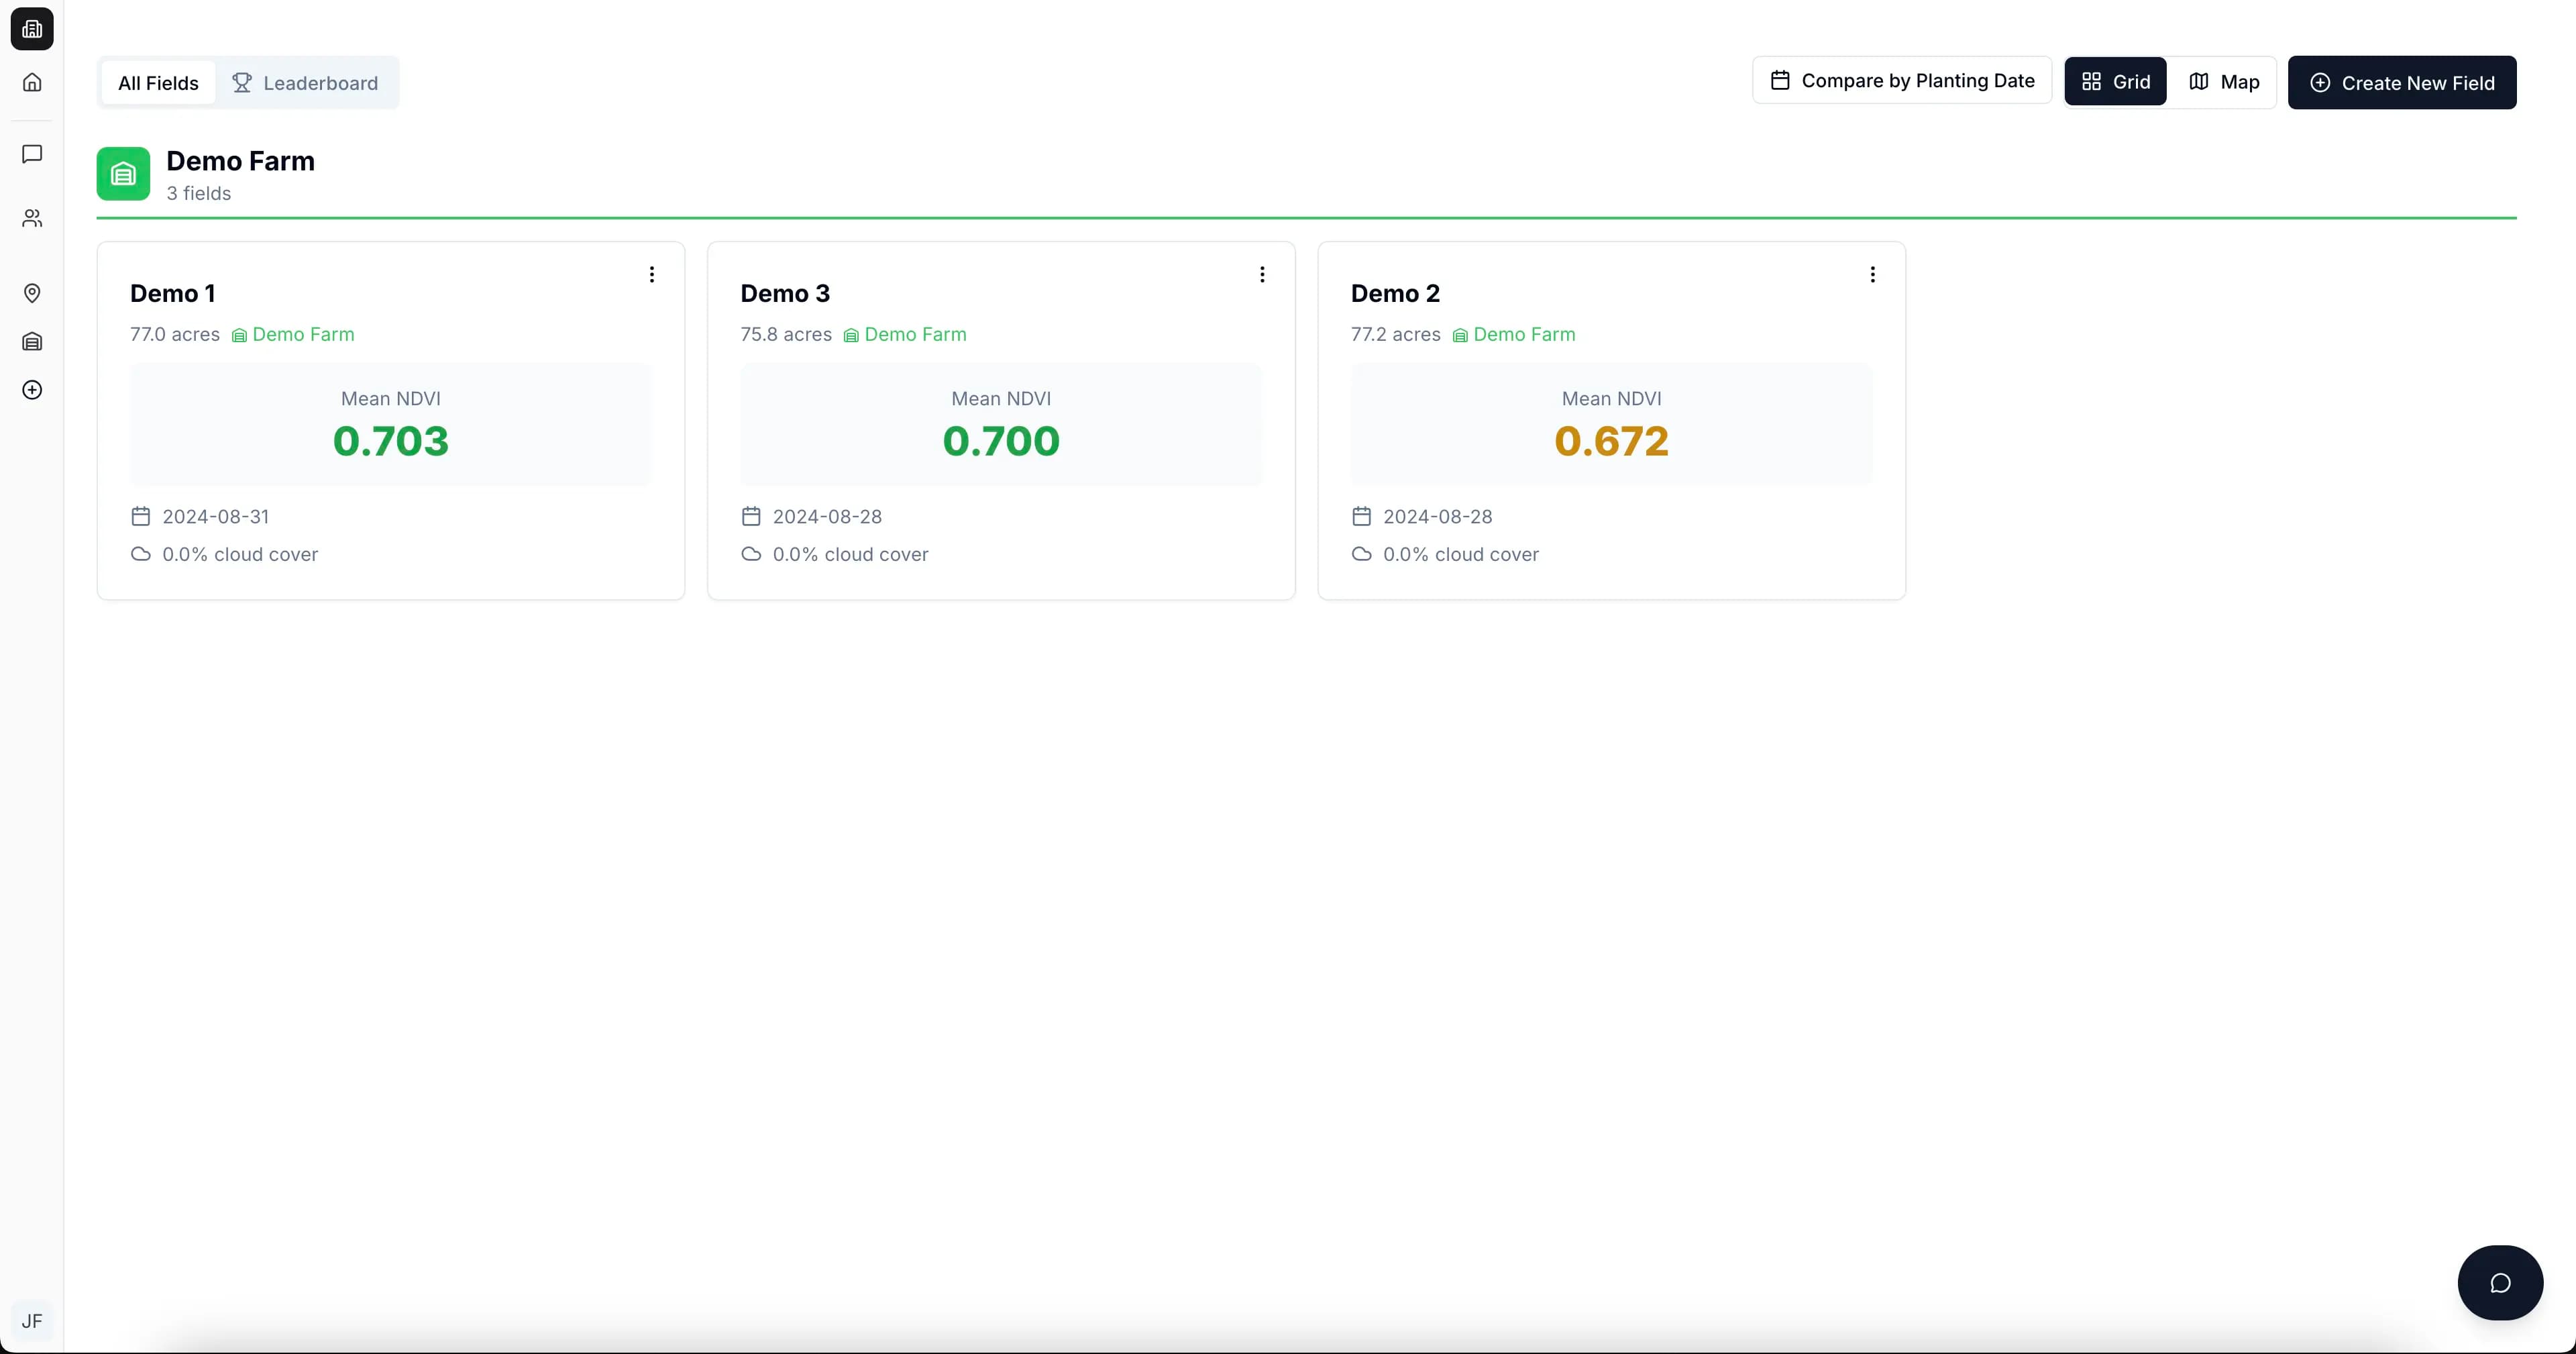
Every field, every farm, at a glance. Each card shows the current satellite view, vegetation health score, and days since last imagery.
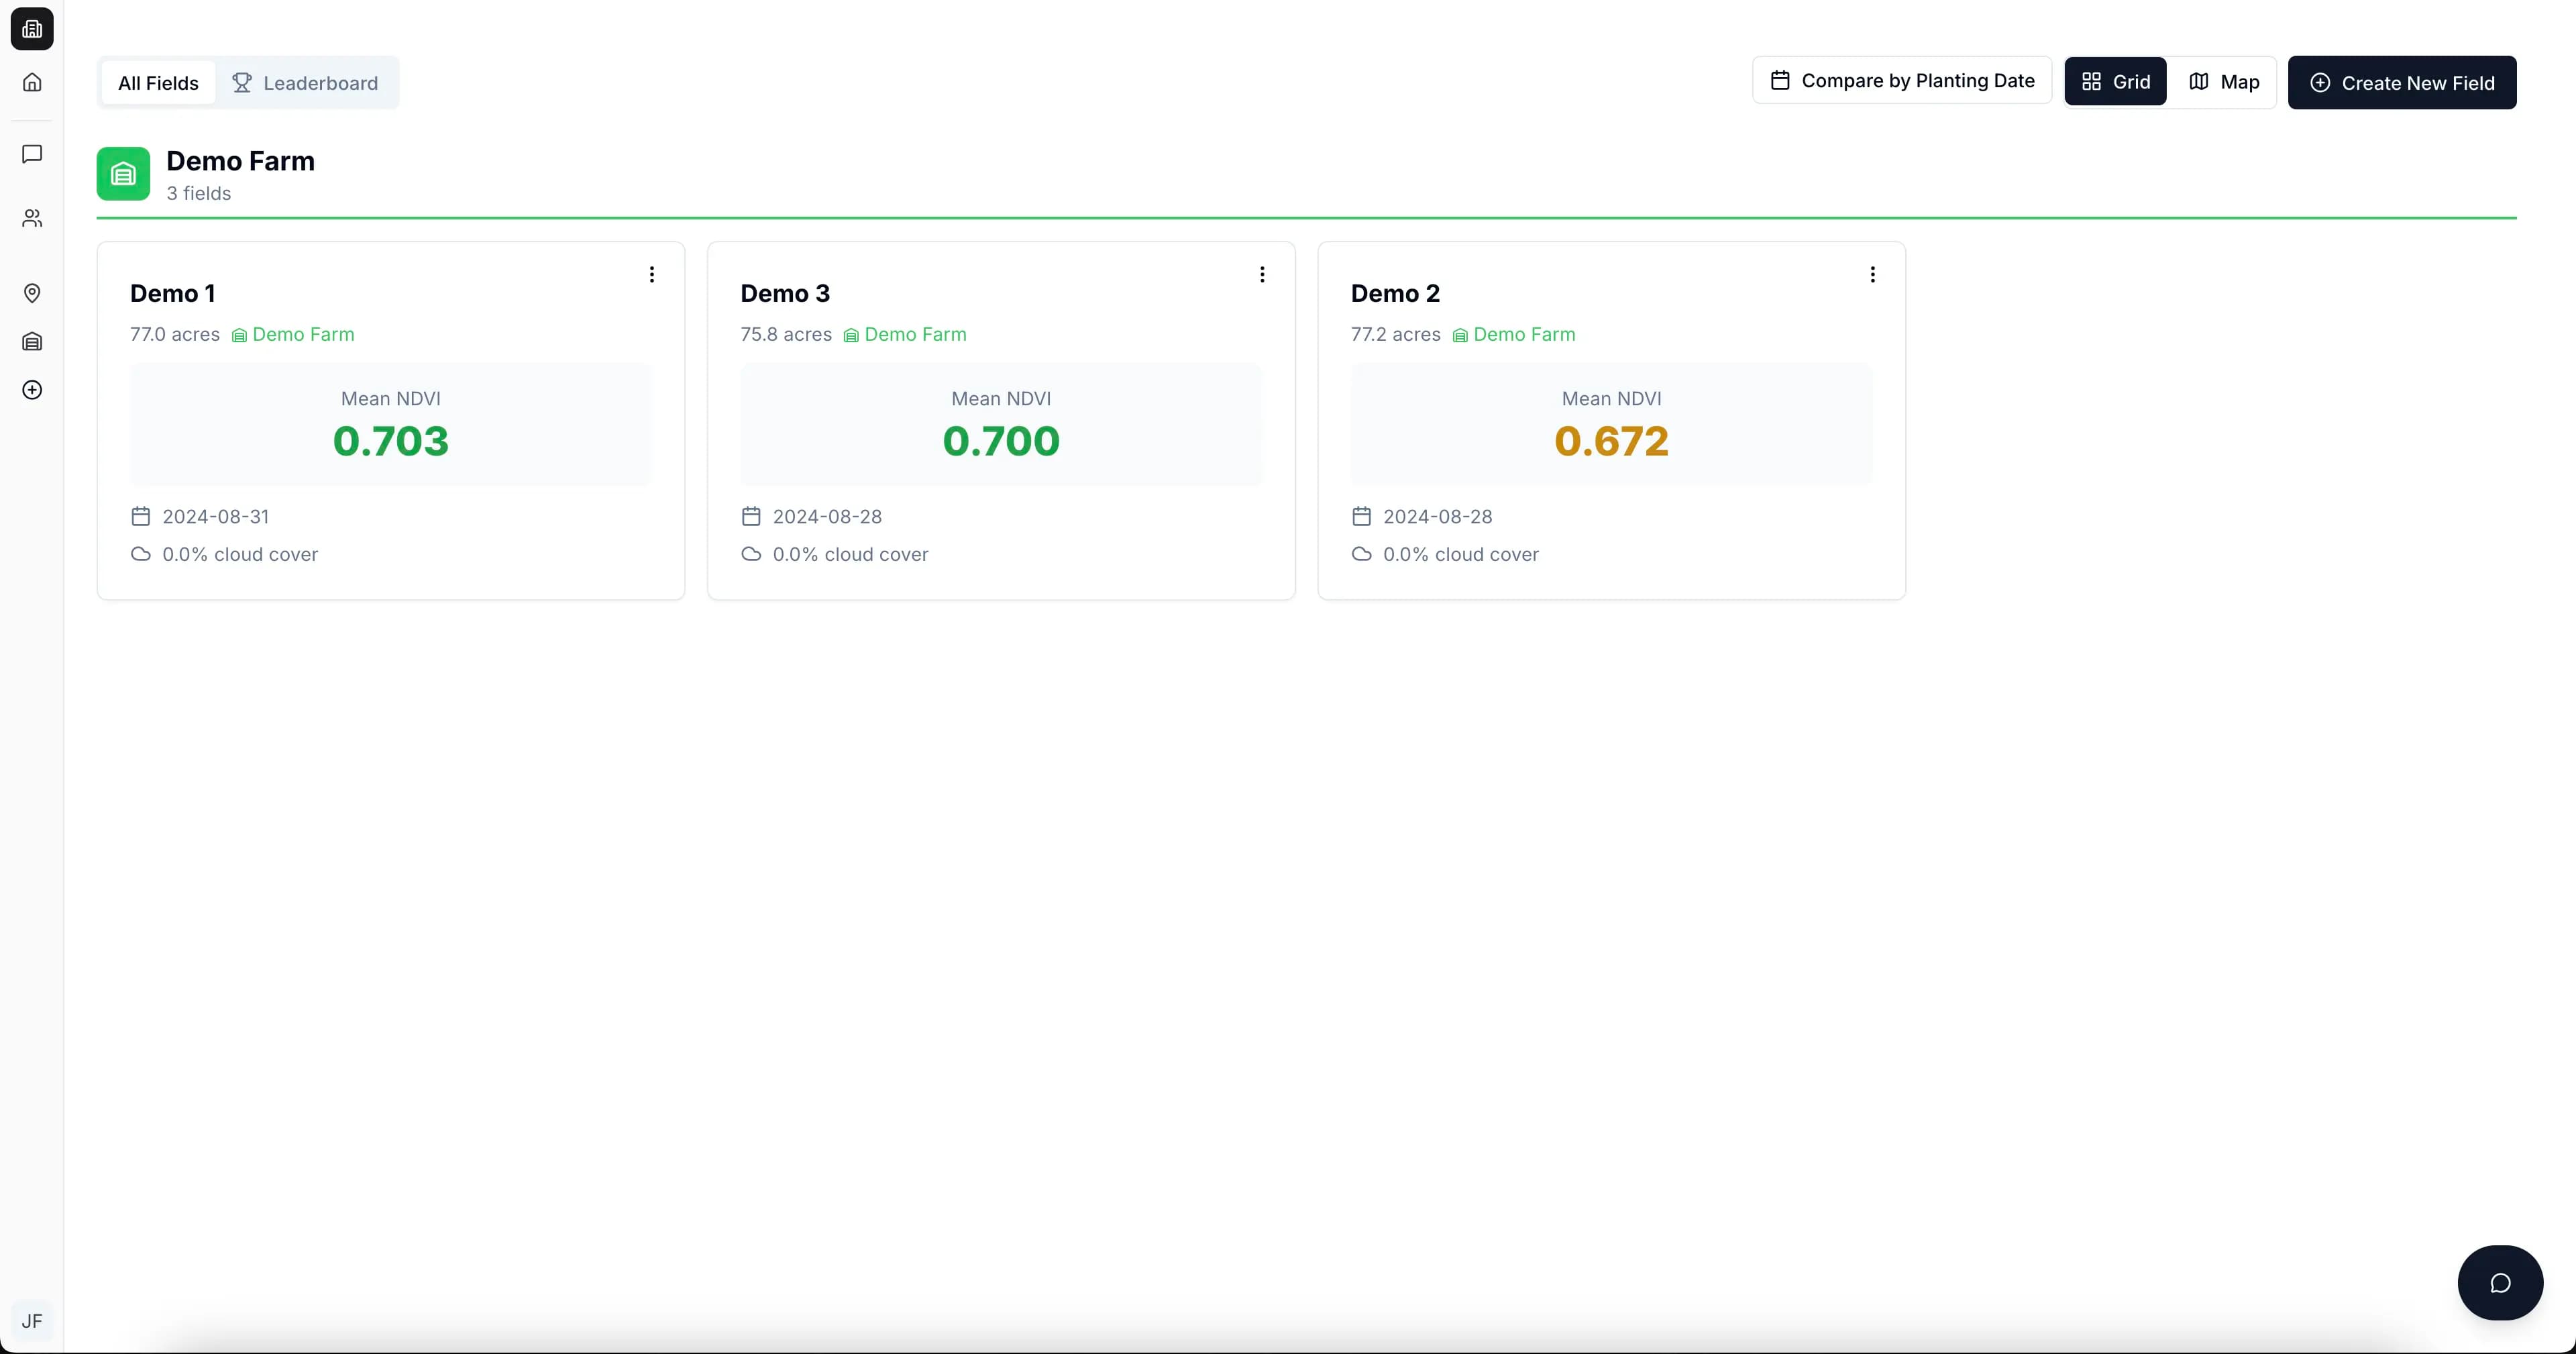
See every field positioned on the map with real-time health status. Pull it up from your truck and know exactly where to drive.
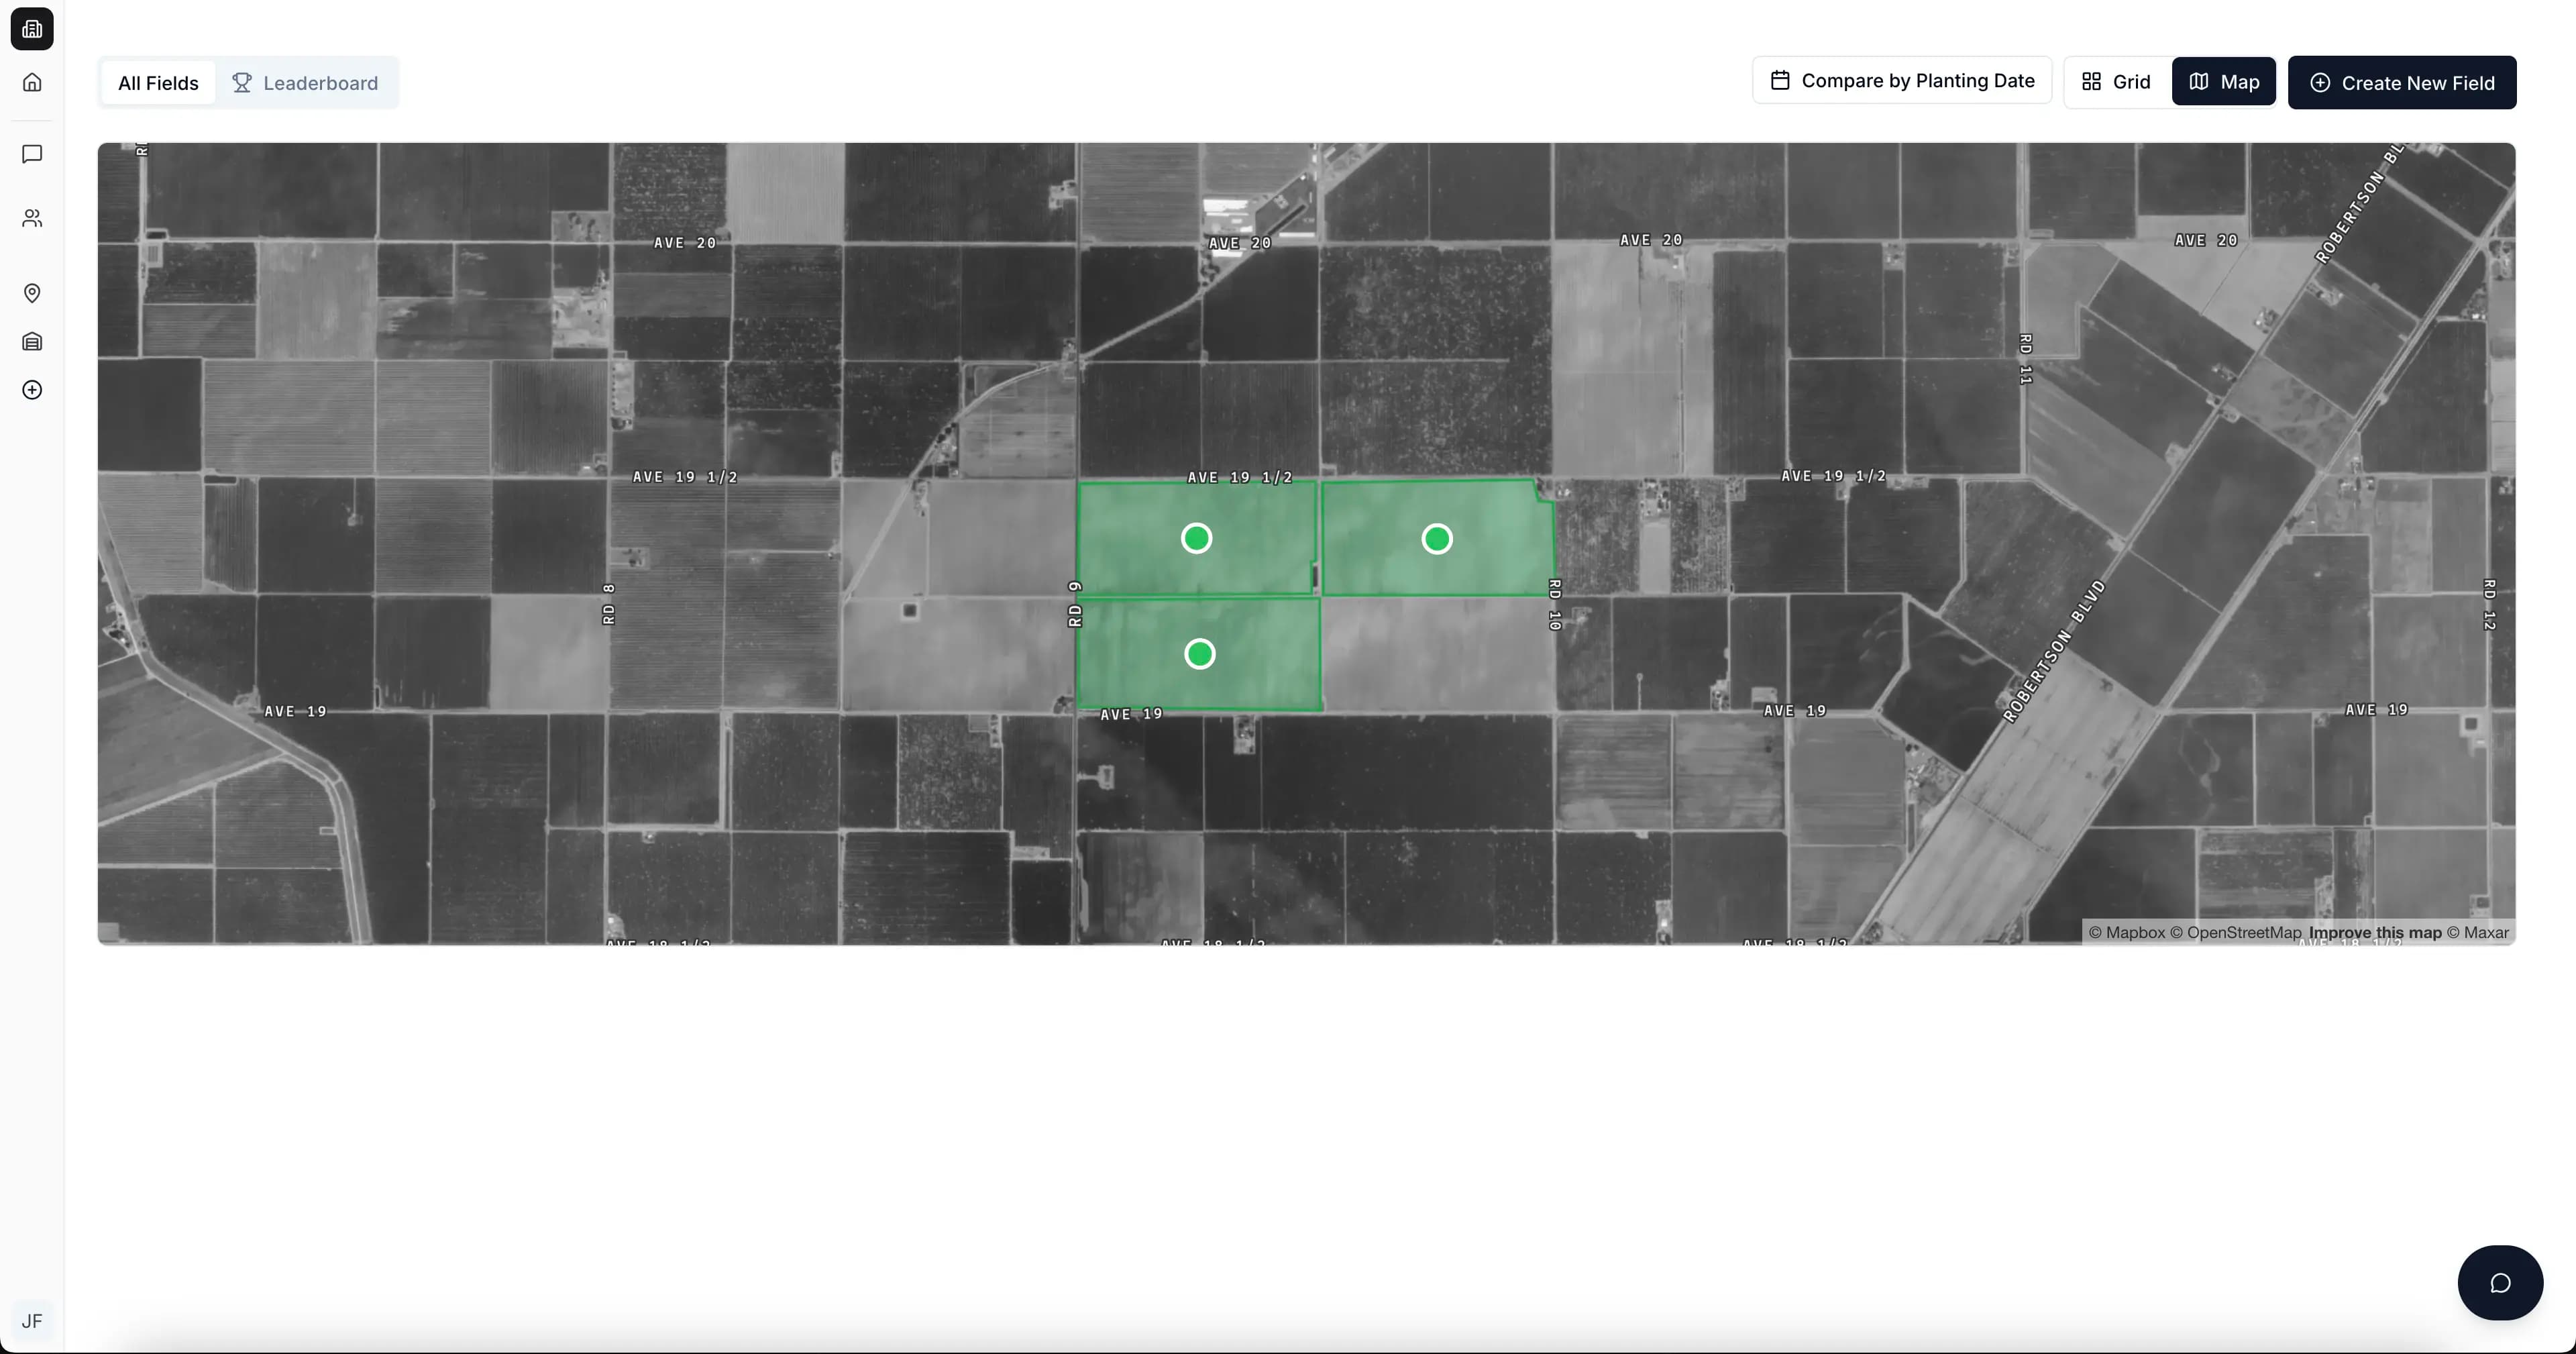
Rank every field by vegetation health, stress level, and uniformity. Sort by stress to find which fields need attention today. Group by planting week to compare apples to apples.
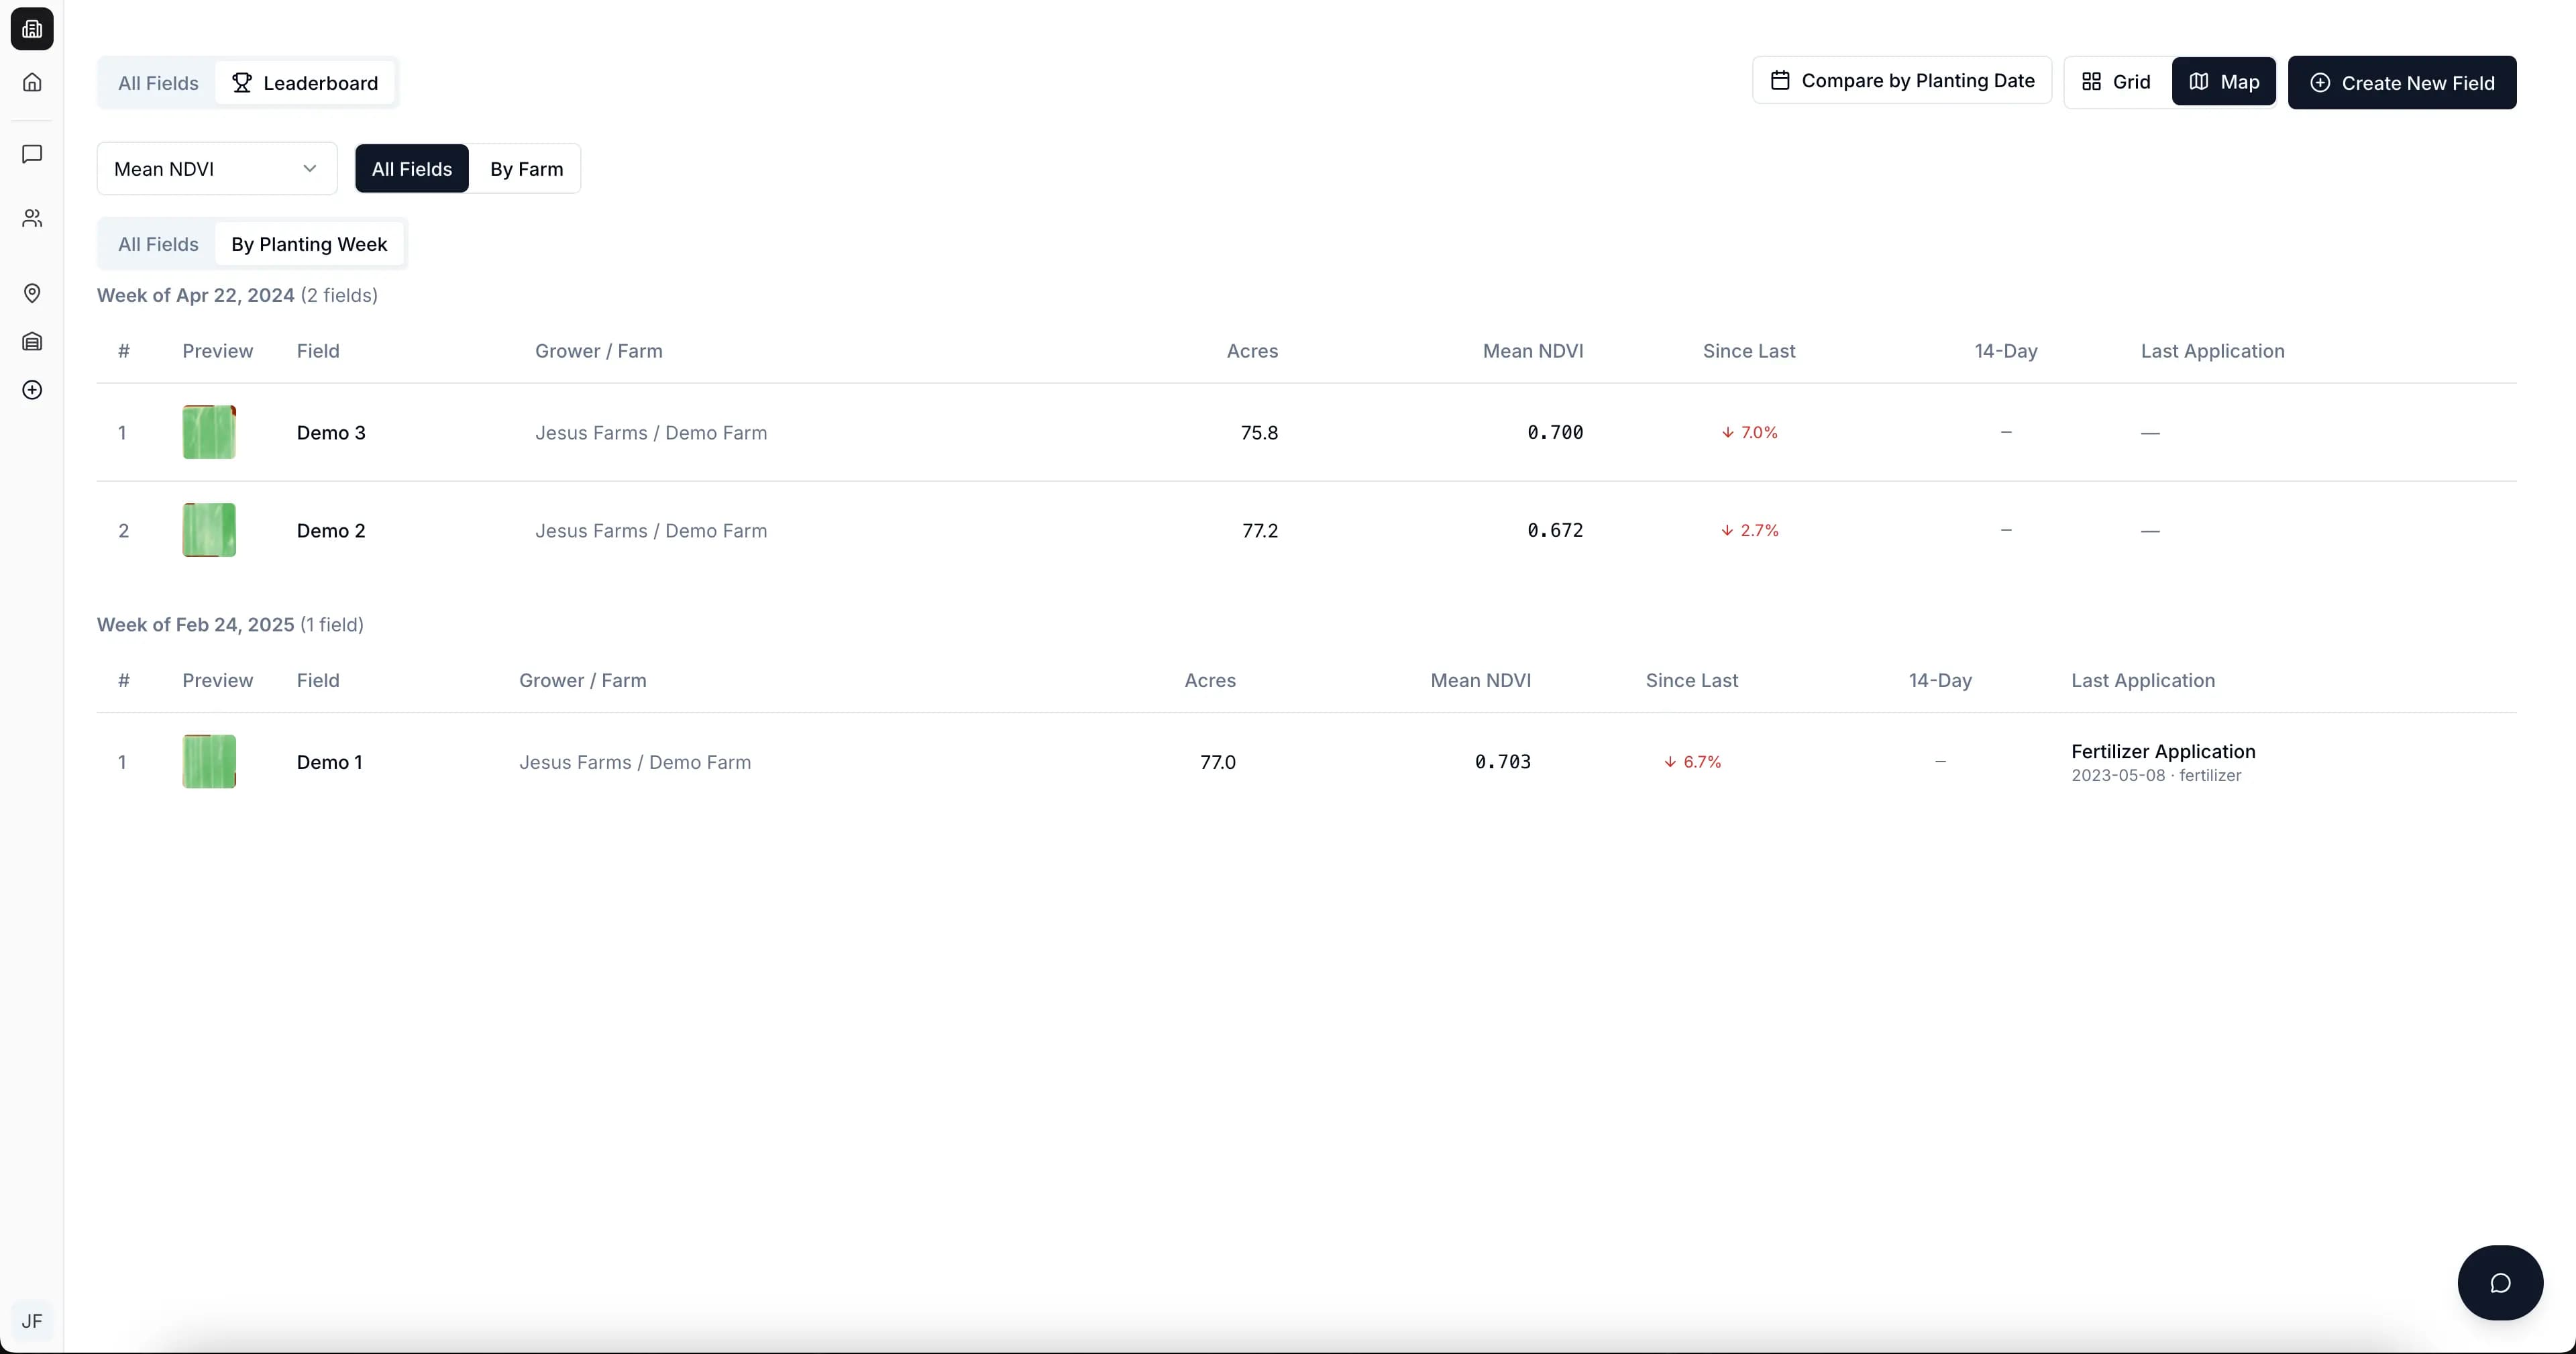
“This replaces the morning drive and the guesswork. Know exactly where to focus before you leave the house.”
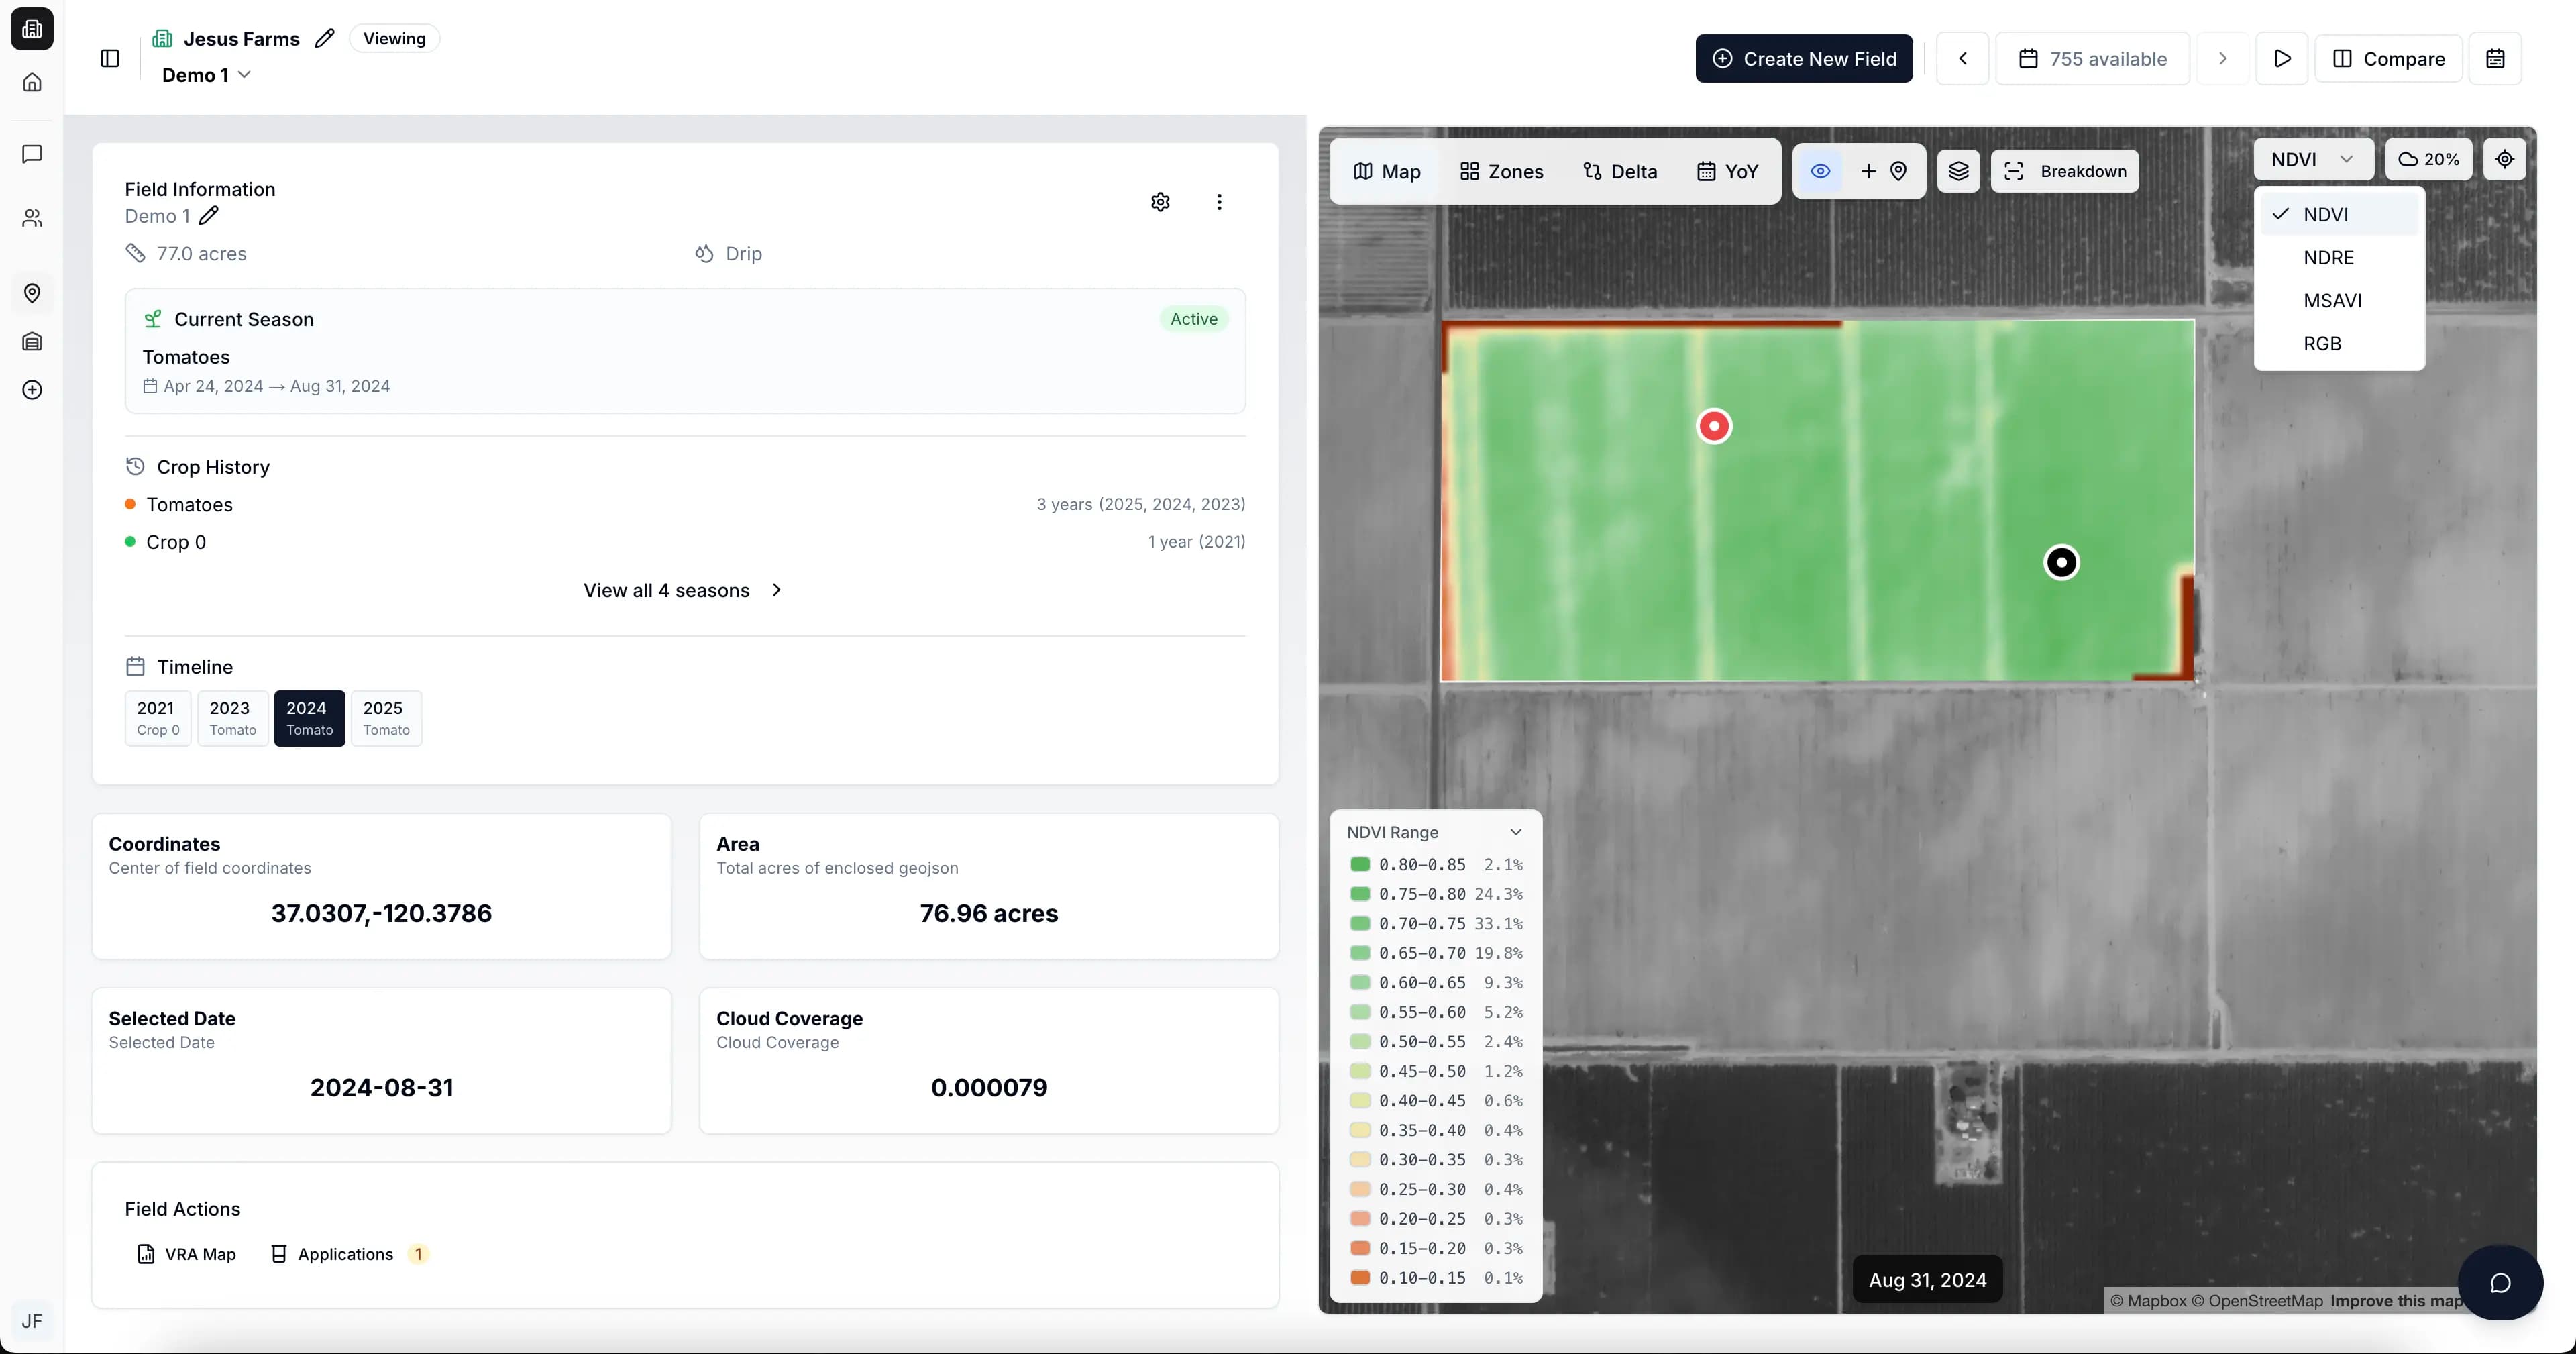
Watch the season unfold. Understand every zone.
Dive into any field for multi-spectral imagery, growth tracking, soil analysis, and weather correlation.
Four vegetation indices, one view
Overall photosynthetic activity — how much green, living tissue
Chlorophyll and nitrogen status at the cellular level
Optimized for early season with bare soil between rows
True-color satellite photo — what it actually looks like
See where you're headed before you get there.
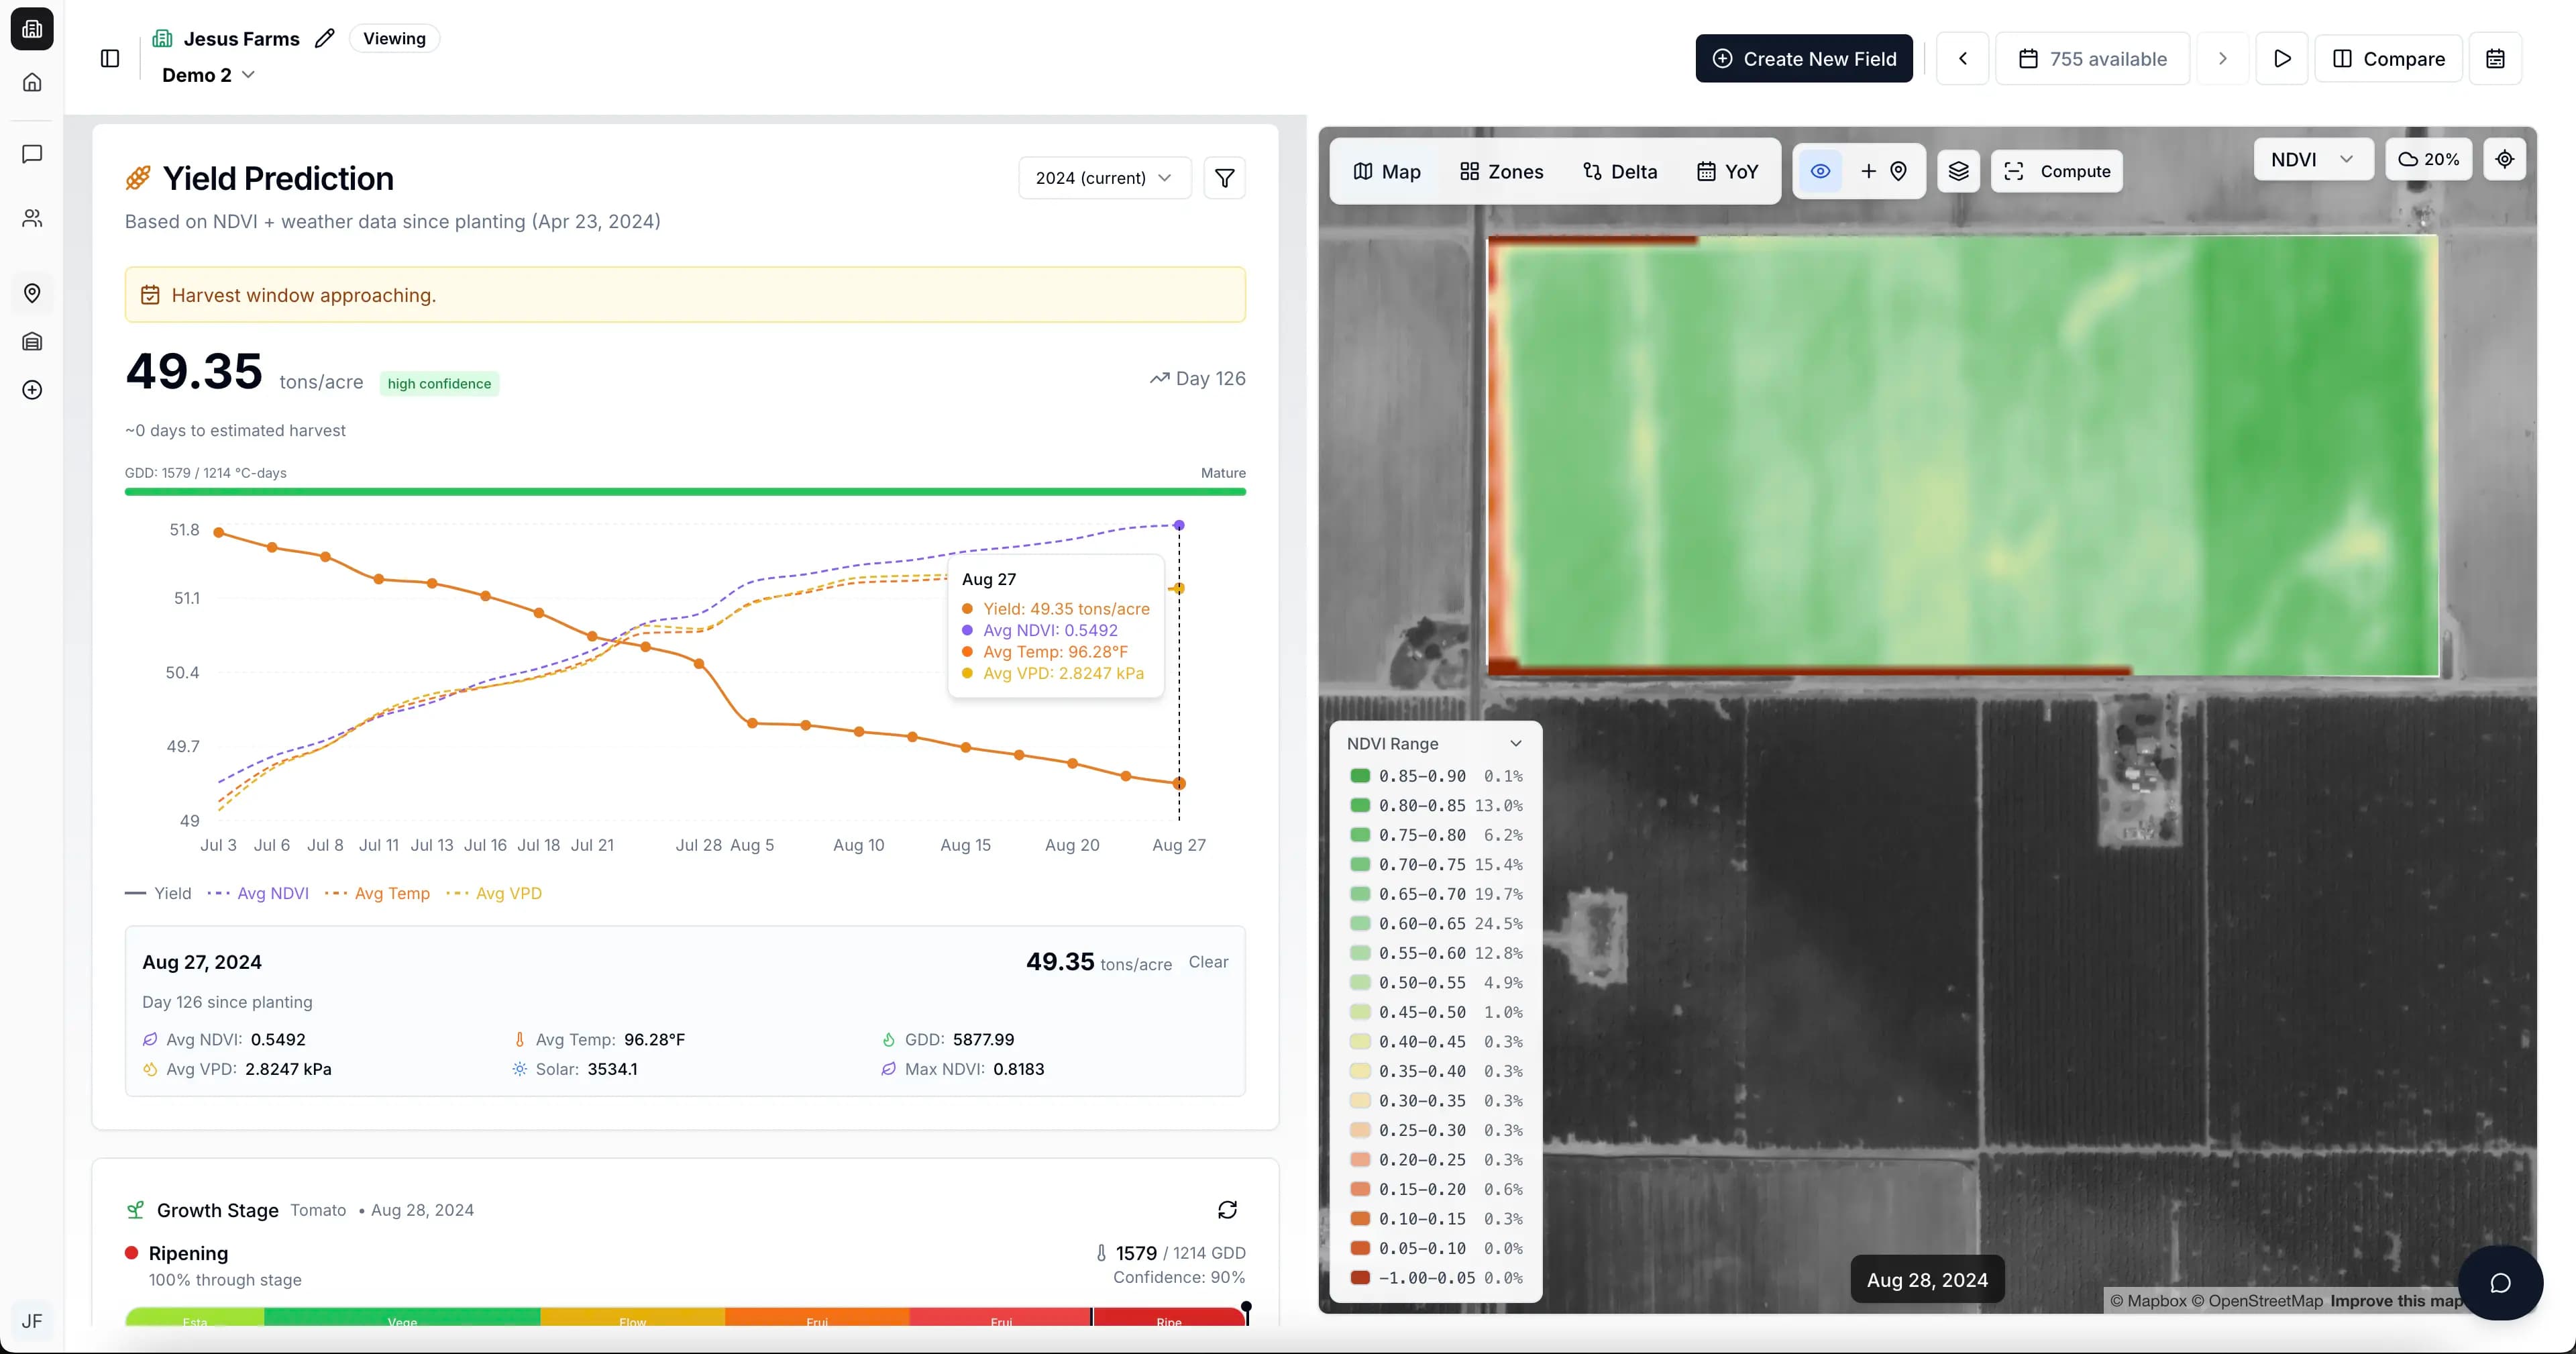
AI-powered yield prediction based on NDVI trajectory, weather patterns, historical yields, and growth stage.
“How much will I harvest?”
The ultimate question — answered with data, not guesswork. Overview predicts yield using satellite trajectories, weather accumulation, and field-specific history.
- Predicted yield with confidence intervals
- Timeline chart showing prediction evolution through the season
- Contributing factors: NDVI, temperature, GDD, VPD, solar radiation
- Actual vs. predicted comparison after harvest
Prediction accuracy: In initial tests, the model achieved predictions within ~9.79 tons (~22% deviation). After refining the dataset to typical yields (40–60 tons/acre) and removing outliers, accuracy improved to within 5.11 tons — approximately 9.8% deviation from actual yields.
“Processors plan logistics. Growers negotiate contracts. Everyone makes better decisions.”
Turn insight into action.
Knowledge without action is worthless. Go from satellite imagery to sprayer in five minutes.
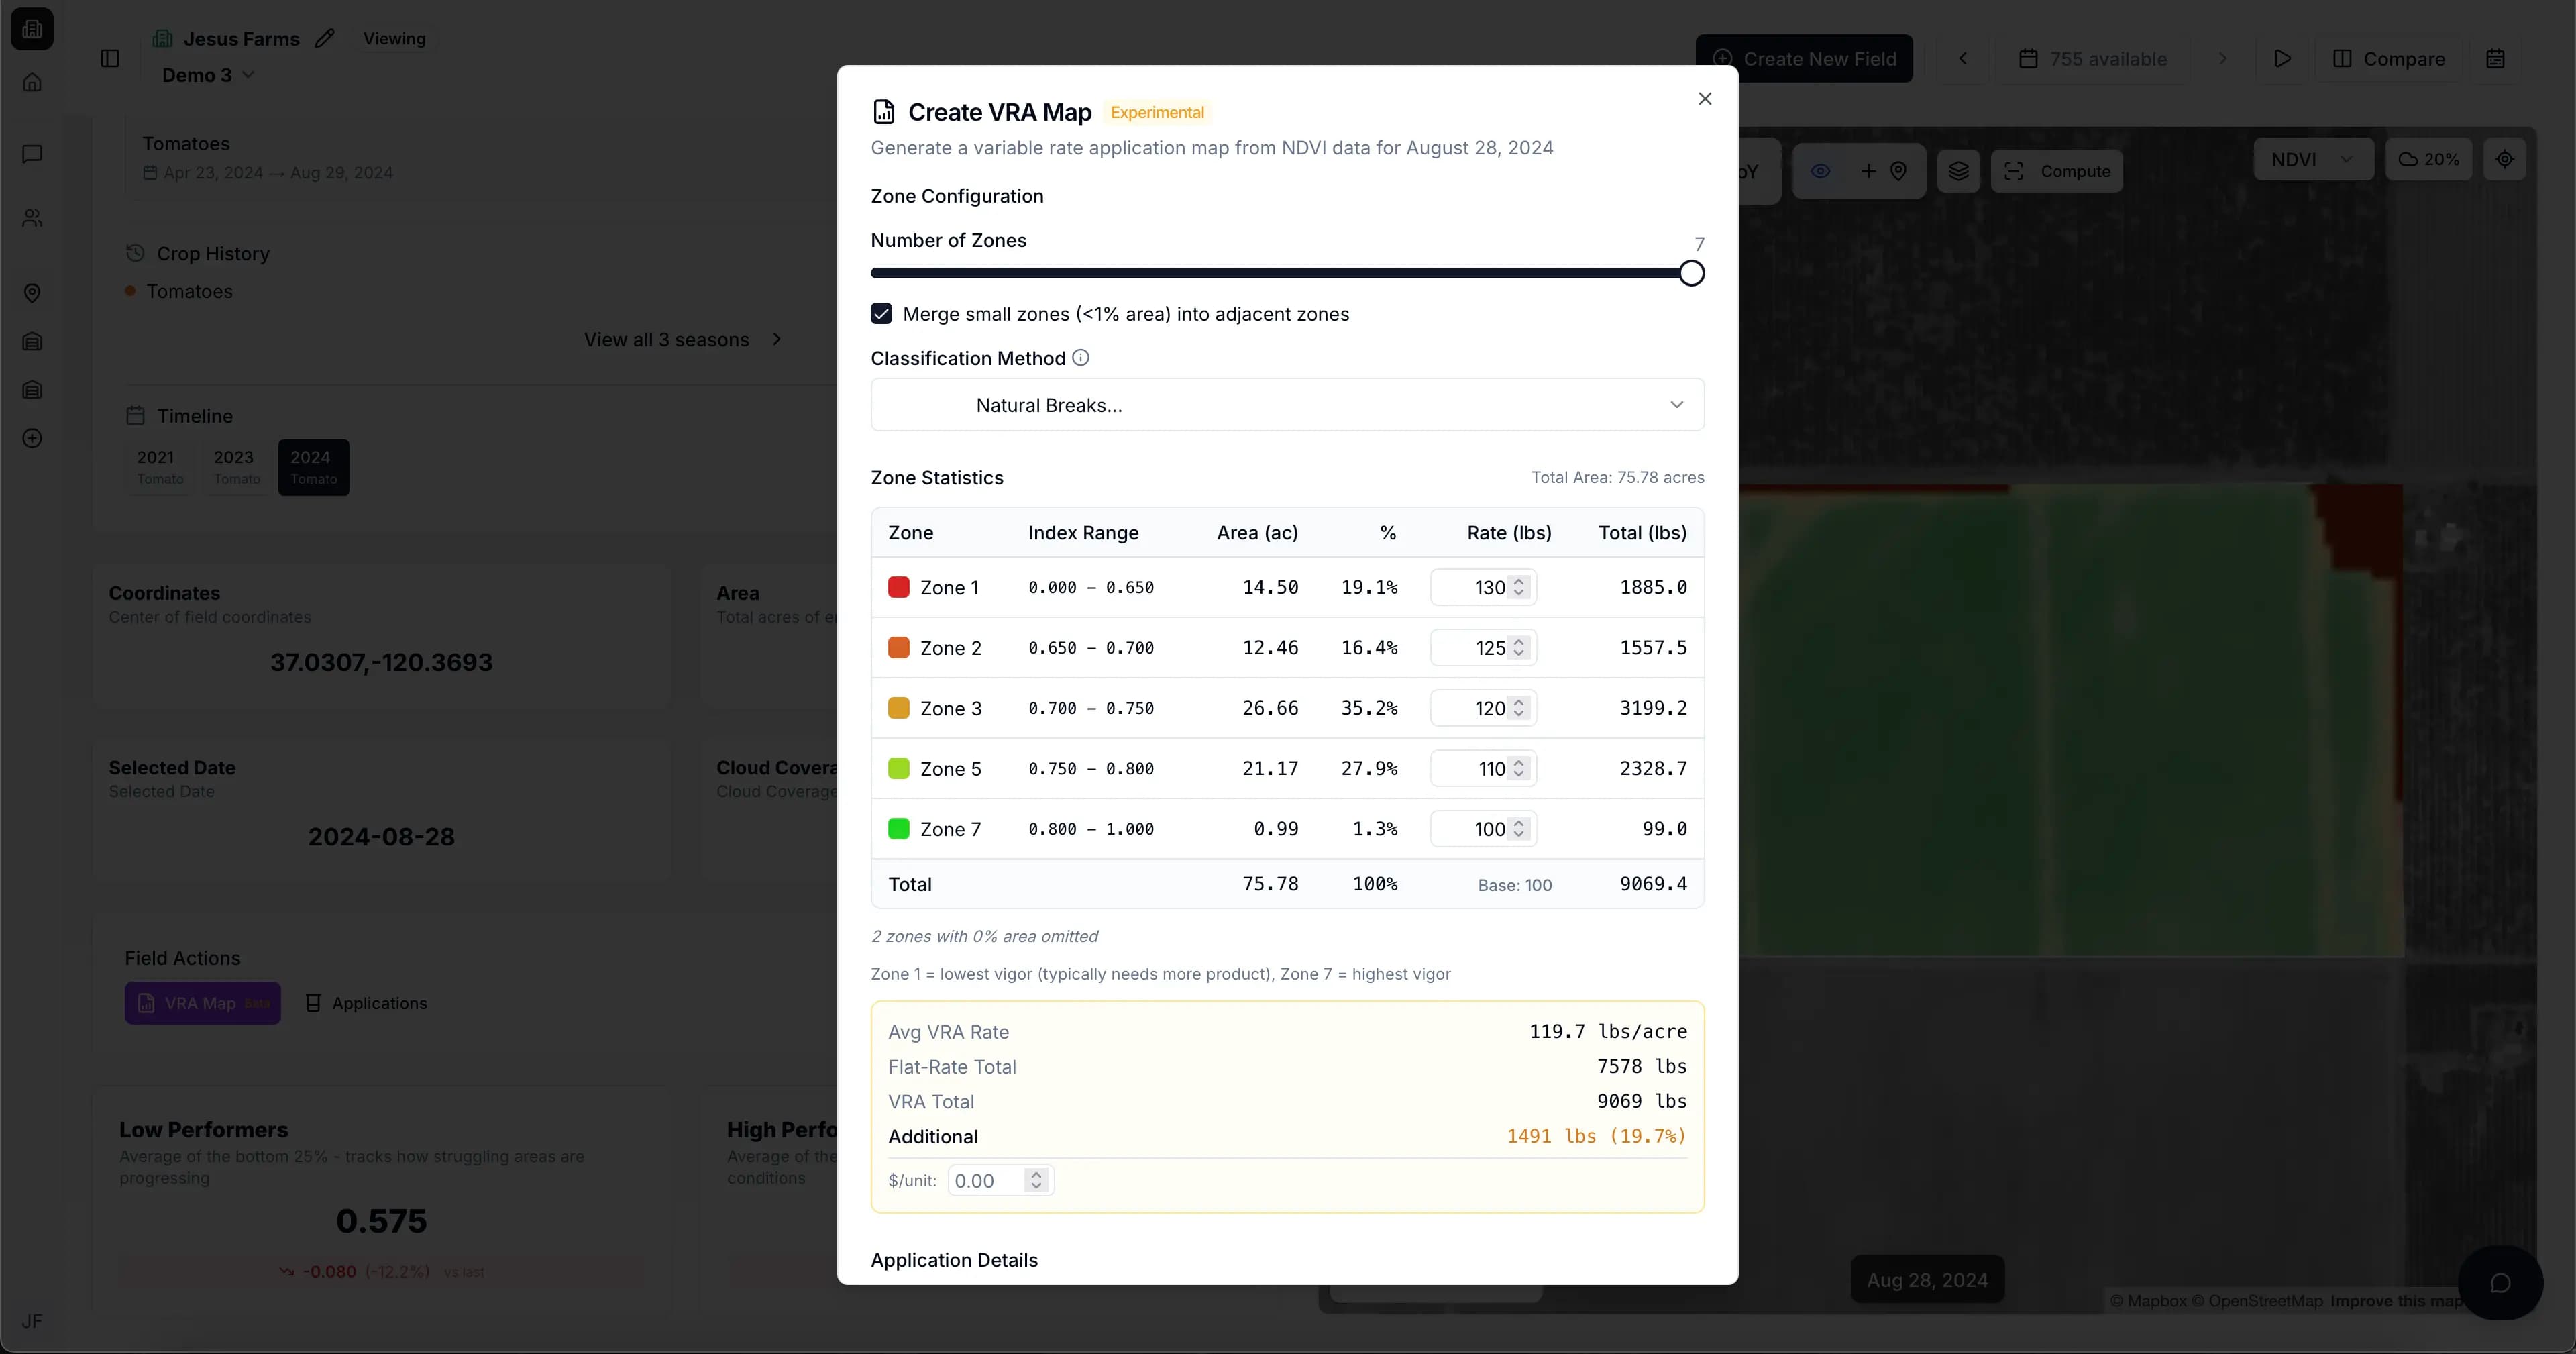
Create variable rate application maps directly from satellite imagery. Choose classification method, set base rates, and export.
Shapefile (John Deere) · GeoJSON (Climate FieldView) · GeoTIFF · Geo-referenced PDF
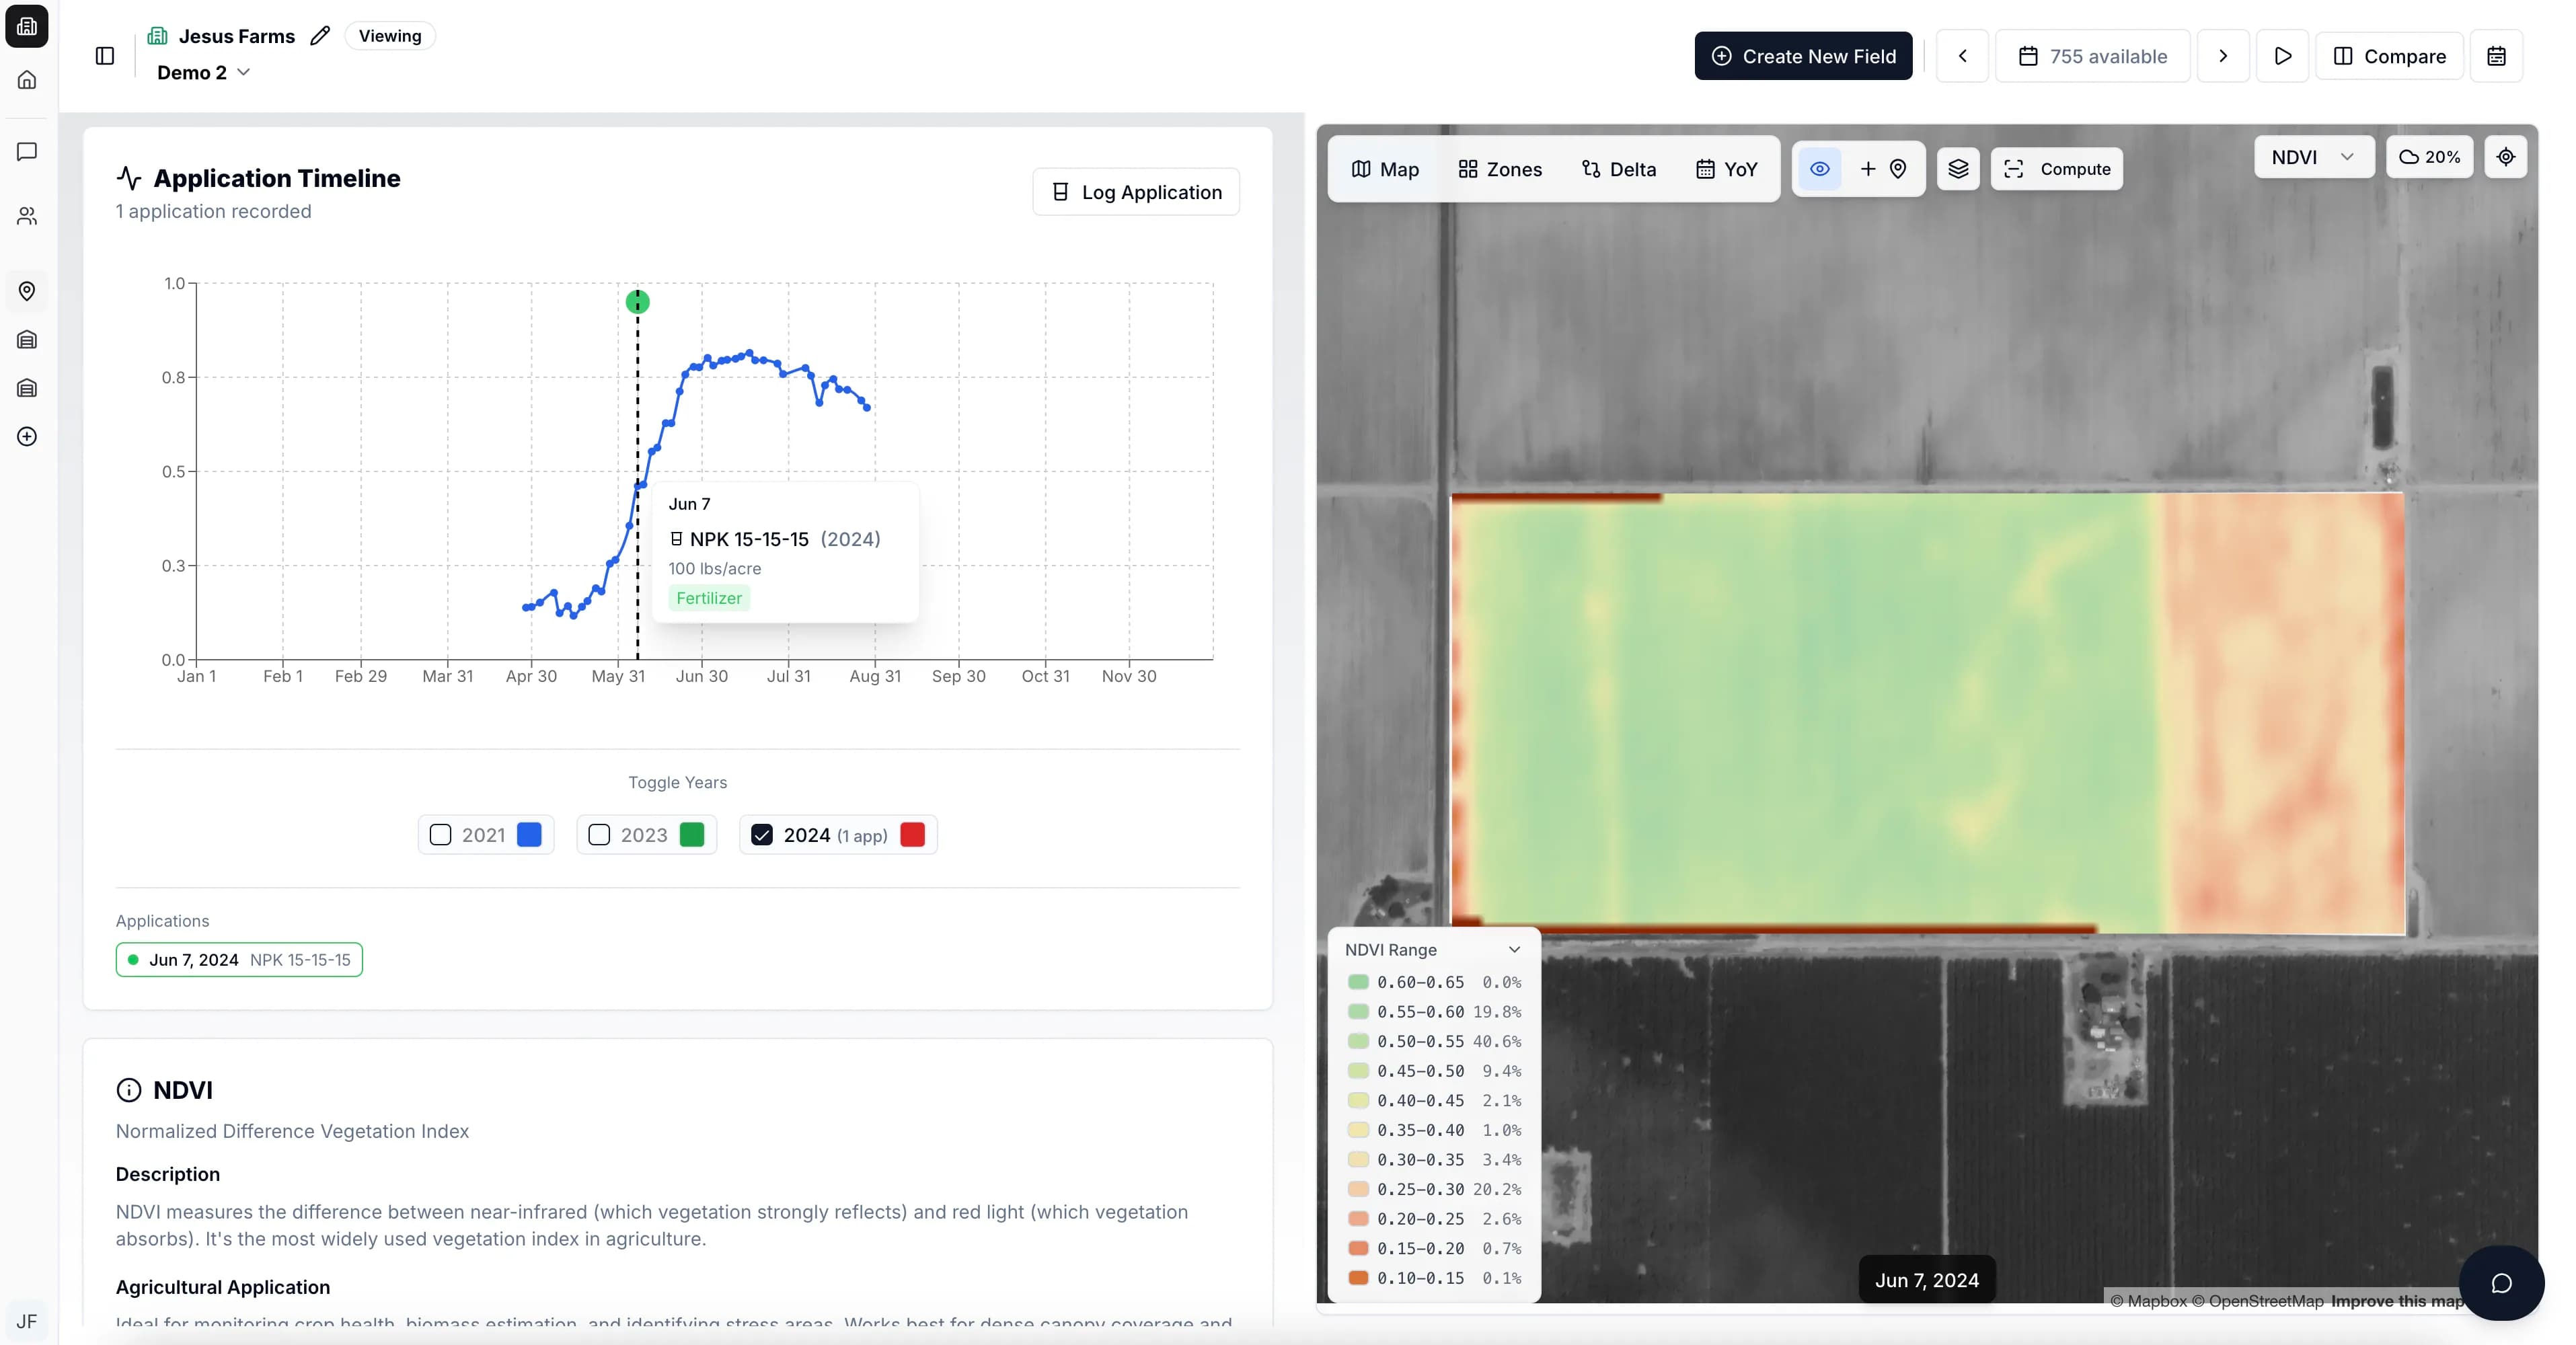
Log treatments with product, rate, method, cost, and weather conditions. On the next satellite pass — see whether it worked.
The closed loop: satellite to sprayer to outcome — all in one system.
Drop pins directly on the map with photos, GPS coordinates, and notes. By harvest, you have a complete field record.
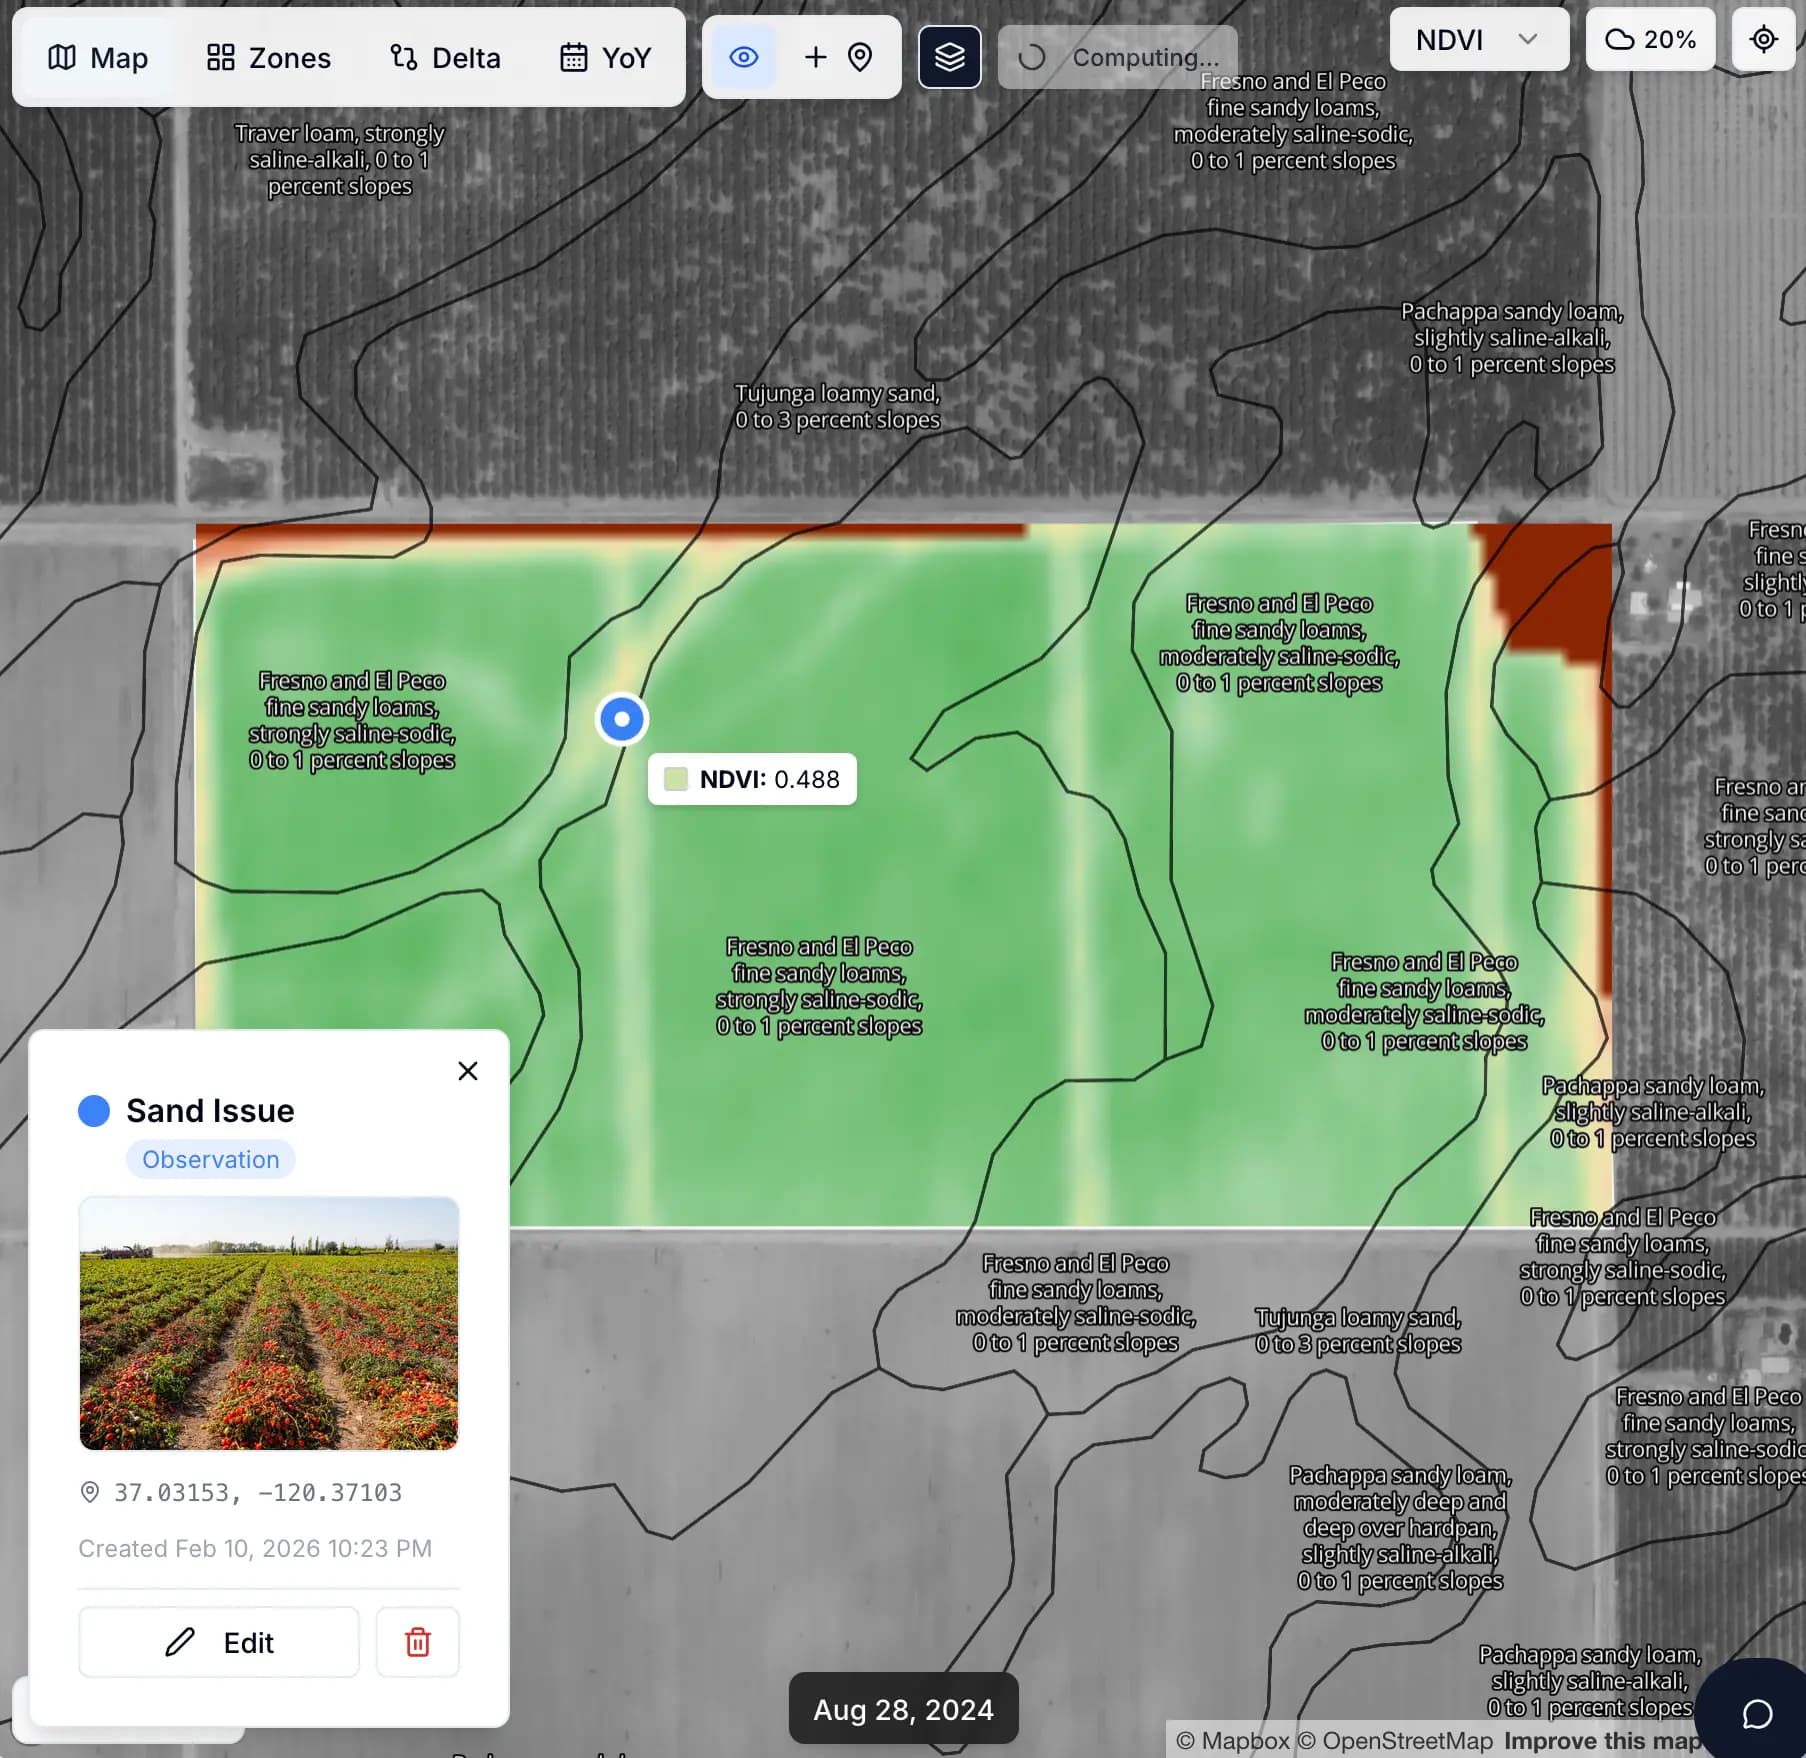
Ask anything. Compare everything.
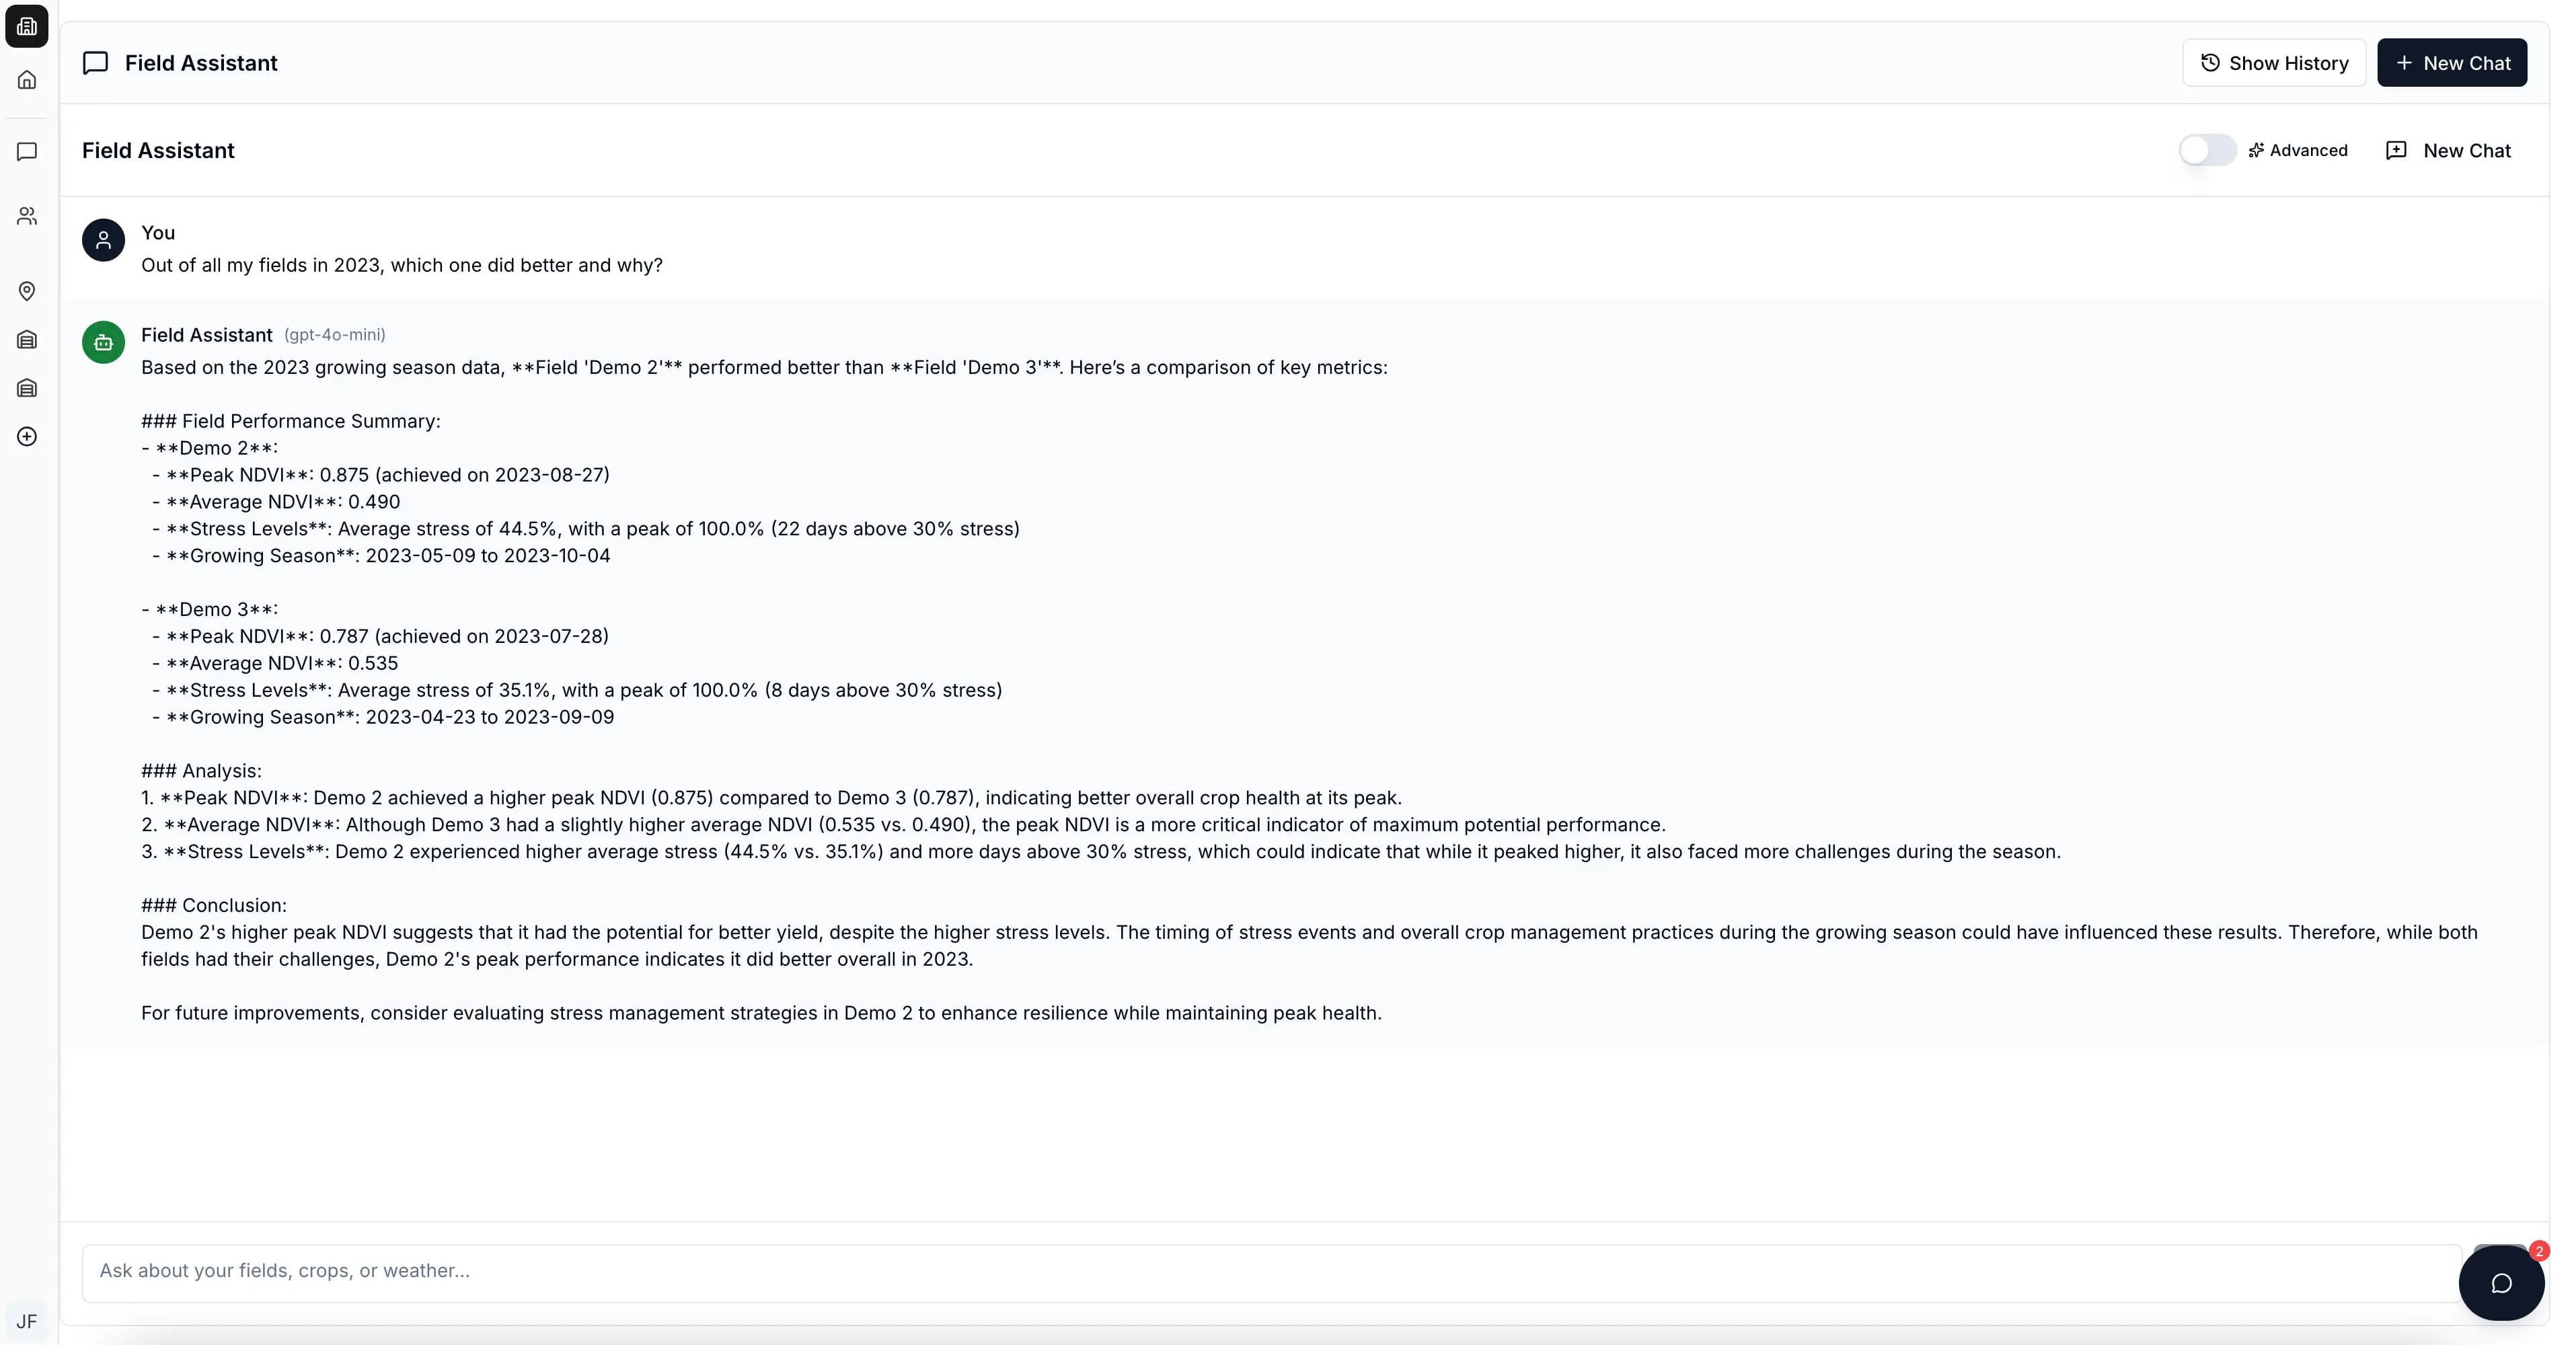
AI-powered insights and sophisticated field comparison tools.
Ask questions in natural language. The assistant has access to all field data — imagery history, weather, applications, soil types — and synthesizes answers with specific recommendations.
“Why is the southeast corner of Field 12 underperforming?”
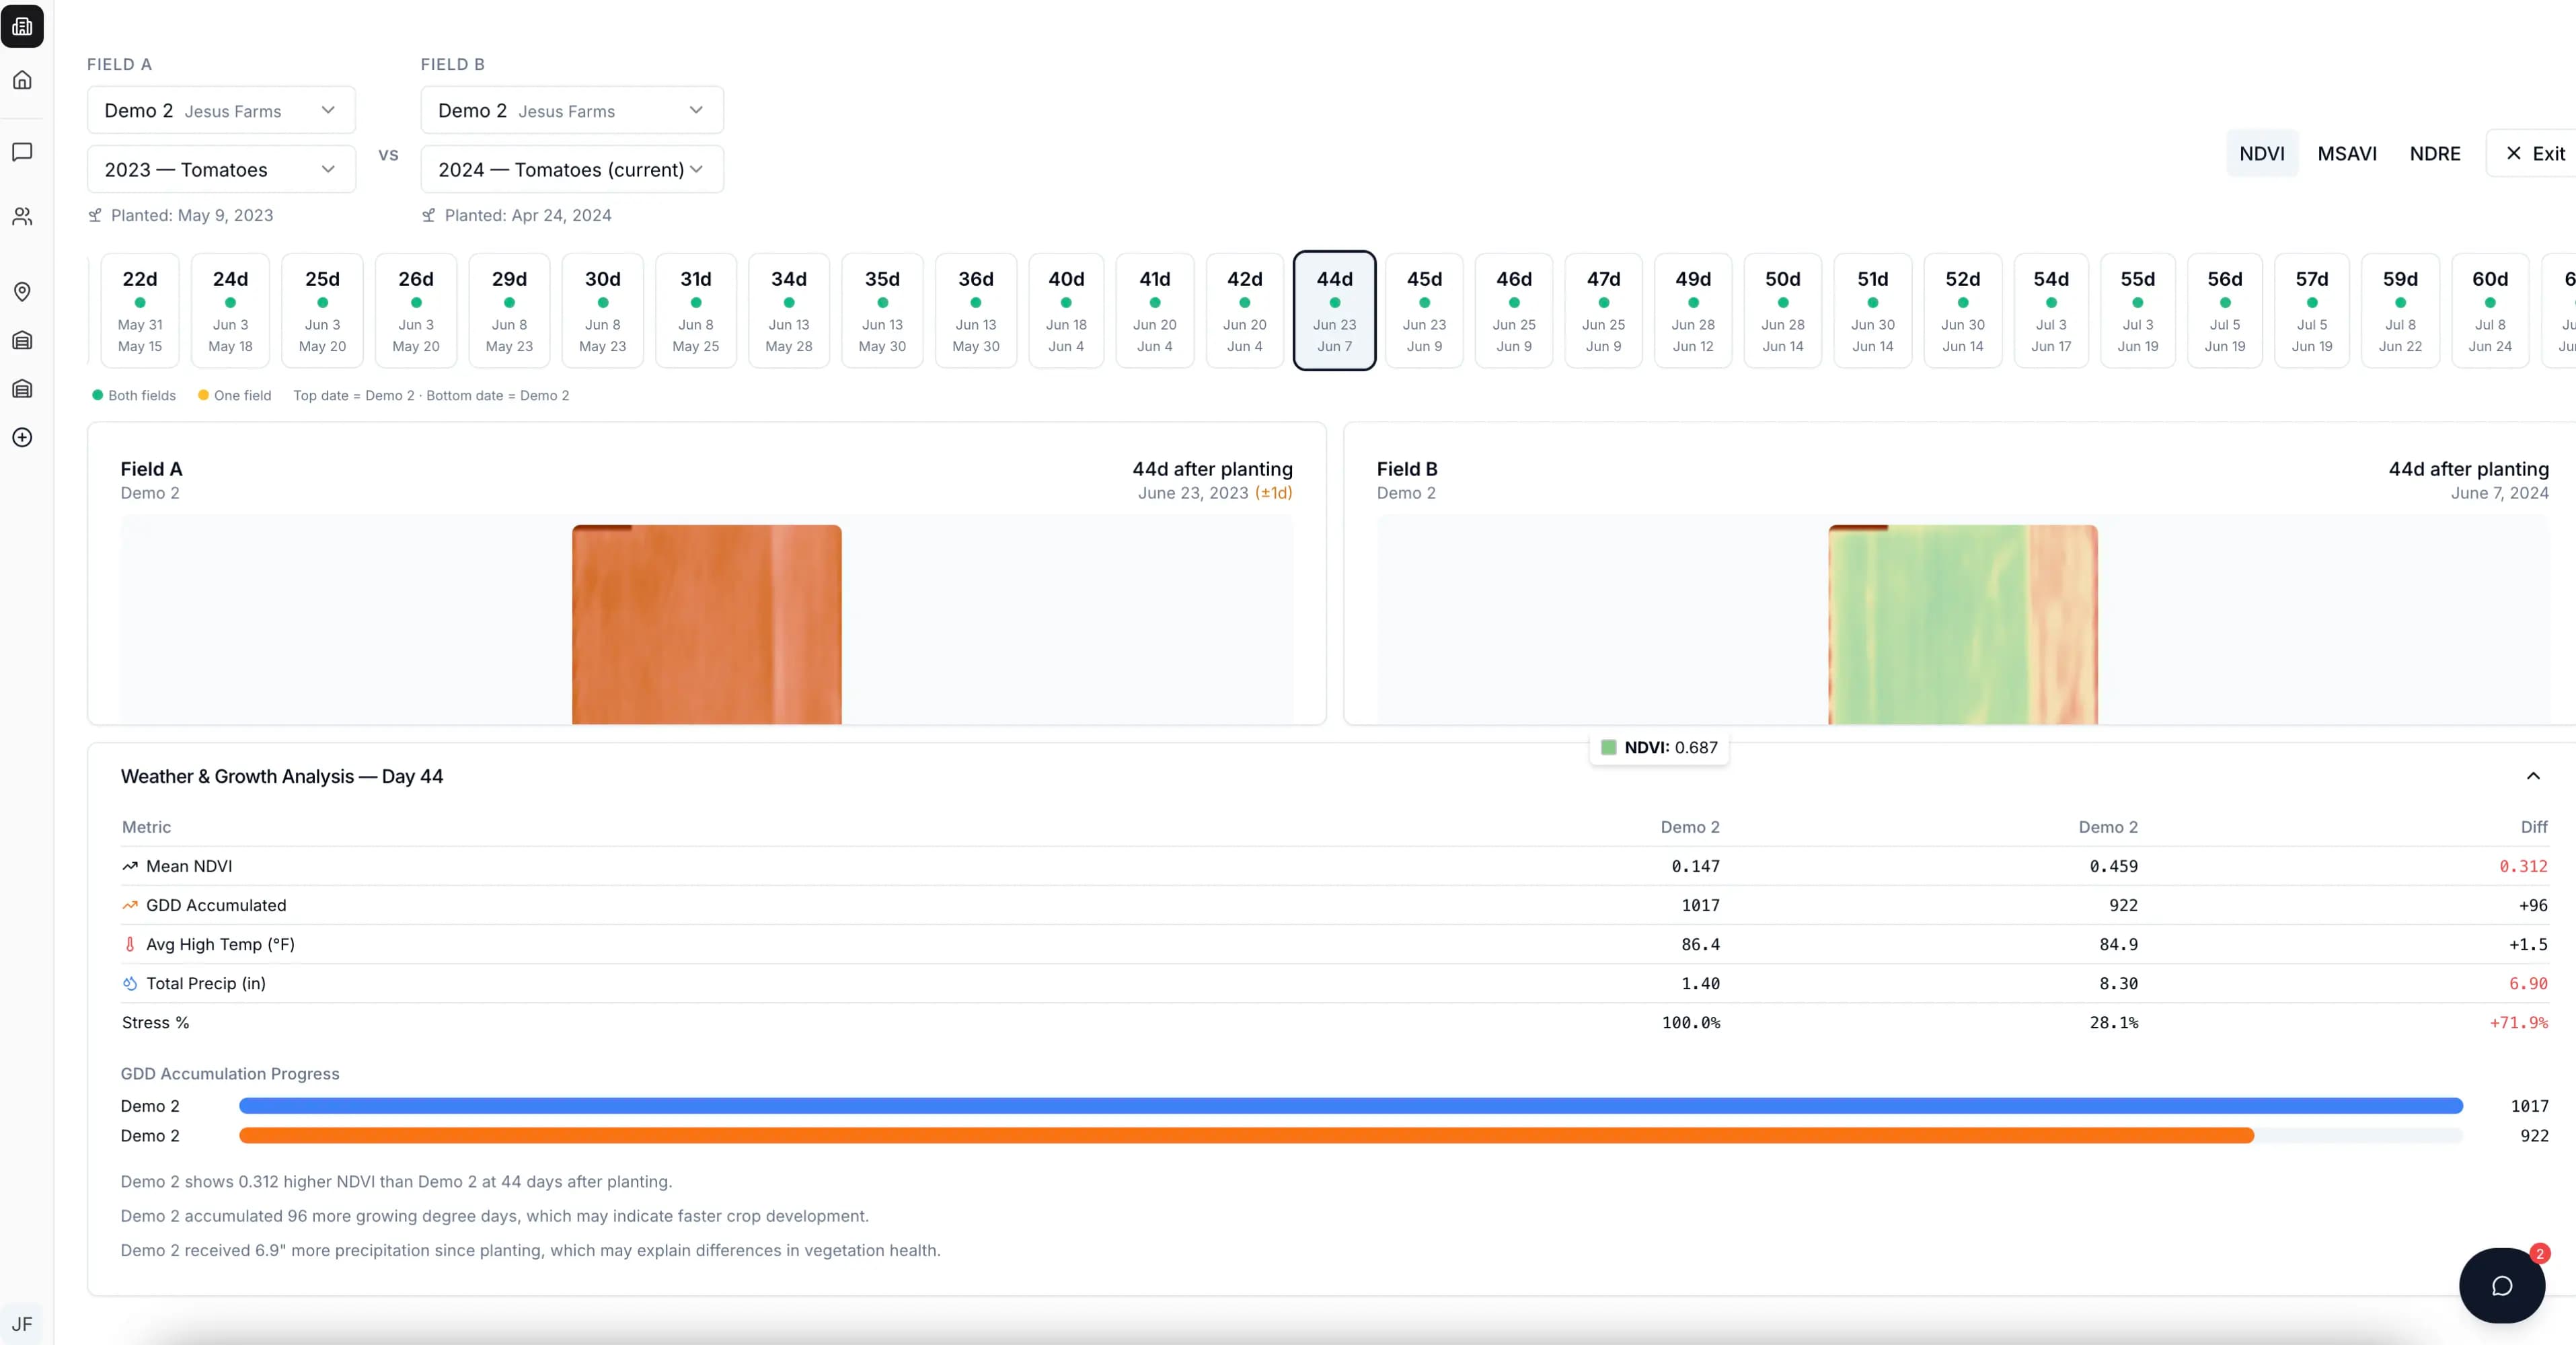
Compare fields side-by-side aligned by days since planting — not calendar date. At 45 days after planting, which field was healthier? And why?
Control for planting window. Isolate what actually made the difference.
Sentilli Control
Harvest Operations & Logistics
Plan the harvest. Execute it in real time.
From pre-season simulation to live operations — manage every crew, truck, and factory run.
Track every piece of equipment in real time. Know who's harvesting, who's idle, and who's stuck — before it costs you a day.
Real-Time GPS Tracking
10-second polling with speed, heading, and field association for every harvester, tractor, and truck.
Activity Classification
Automatic detection: harvesting, idle, transit, loading, unloading, headland turn, waiting for capacity.
Equipment Management
Full registry with header width, load capacity, telematics IDs, and operational status tracking.
Crew Scheduling
Organize equipment into crews with shared working hours, configurable break cycles, and field visit sequences.
Events & Alerts
Breakdowns, weather delays, shift changes, idle equipment — with severity levels and batch resolution.
Yield Collection
Log tons, tons/acre, load count, Brix, green %, and quality grade per field with equipment association.
Schedule Proposals
Auto-generate schedule changes for rain delays or crew rebalancing — with approval workflow.
Transport Routes
OSRM routing or custom designated routes between fields and factories with waypoint editing on map.
Audit Trail
Complete history of field transitions, equipment assignments, personnel changes, and status updates.
“We ran the simulation in March, adjusted the crew plan, and saved $40K in overtime before the first truck rolled.”
Every other tool gives you a fragment. Monitoring in one tool. Logistics in another. Irrigation in a spreadsheet.
Sentilli connects monitoring, simulation, and operations into one continuous system.
Built for the crops you grow
Overview works across all major crops. Some advanced features are crop-specific as we expand support.
Don't see your crop? Let us know — we're actively expanding crop-specific models.
Crop monitoring & intelligence
Choose the plan that fits your operation. Billed per organization.
500 acres included · Up to 8,000 acres · 5 users
- Satellite imagery (NDVI, NDRE, MSAVI, RGB)
- Historical timeline & multi-year comparison
- Side-by-side & slider date comparison
- Leaderboard & Smart Algorithm
- Field stats, distribution & weather overlays
- Growth stage tracking & GDD
- Soil map overlay (view only)
- Basic scouting waypoints
- Field, crop year & farm management
- Team management (5 users)
Add-on: +500 acres for $100/mo
Intro pricing for your first 12 months
Then $350/mo · 3,000 acres included · Up to 8,000 acres · 15 users
Everything in Basic, plus:
- AI Stress Analysis (score, drivers, trends)
- AI Field Chat with insights generation
- AI Season Insights (per crop year)
- AI Yield Prediction with timeline
- Daily automated monitoring & email alerts
- Application tracking & effectiveness
- VRA Prescription Maps Experimental
- Full soil intelligence & breakdown
- Waypoint photos, categories & clustering
- Mobile: disease scouting & photo verification
Add-on: +500 acres for $50/mo
Intro pricing applies for your first 12 months. Renews at standard rate unless canceled.
Unlimited acres · Unlimited users
Everything in Pro, plus:
- Custom indices, alerts & dashboards
- API access & data exports
- SSO & role-based access control
- SLAs & priority support
- Dedicated onboarding & training
Both plans include the core platform
Pro unlocks AI-powered analysis, automation, and actionable outputs.
Included in Basic & Pro
What’s different
| Feature | Basic | Pro |
|---|---|---|
| Dashboard & Map Tools | ||
| Field grid, map & leaderboard views | ||
| Smart Algorithm (auto-select per field) | ||
| Delta view (change between dates) | ||
| Planting date comparison (cross-field) | ||
| Monitoring & Alerts | ||
| Manual imagery review | ||
| Daily automated monitoring | ||
| Change detection & email alerts | ||
| Alert history per field | ||
| AI & Intelligence | ||
| AI Stress Analysis (score, drivers, trends) | ||
| AI Field Chat (natural language assistant) | ||
| AI Season Insights (per crop year) | ||
| Yield prediction with timeline | ||
| Growth Stage | ||
| Current stage & GDD tracking | ||
| Stage timeline & estimated harvest | ||
| Anomaly alerts & AI recommendations | ||
| Soil Intelligence (SSURGO) | ||
| Soil map overlay | View only | |
| Soil breakdown, drainage & performance | ||
| Scouting & Waypoints | ||
| Waypoint pins & categories | Basic | |
| Photos, colors, clustering & filters | ||
| Action & Output | ||
| Application tracking & effectiveness | ||
| VRA Prescription Maps (Experimental) | ||
| Prescription export (Shapefile, GeoJSON, PDF) | ||
| Mobile App | ||
| Field list, map & offline data access | ||
| GPS waypoints | ||
| Disease scouting with photo reports | ||
| Growth stage photo verification | ||
Common questions
From growers, agronomists, and operations leads.
Want to learn more?
Leave your info and we’ll reach out to discuss how Overview fits your operation.
Stop staring at data. Start running your operation.
Monitor with Overview. Execute with Control. Start your 30-day free trial.